So you’re aware of how important pagespeed is to users and how web performance affects your business. You’ve read about establishing a page speed budget at your organization. And after running some Google Lighthouse audits in Chrome Devtools or plugging a couple of URLs into online tools like Webpagetest, Pingdom or Yellowlab.
But now you want to test more pages, perhaps set some cookies, tweak testing conditions such as mobile emulation and network speed. Or you want to hone in on particular metrics such as Time to Interactive, First Meaningful Paint, Load Time or Bytes HTML/CSS/JS. And you want to automate the whole thing.
You can turn to some excellent – and expensive – monitoring tools like Speedcurve.
Or you can also monitor smaller projects for nix.
In this article, I’ll explain how I test and monitor webpage performance using Webpagetest, Google Lighthouse, InfluxDB and Grafana – fully flexibly and for free.

Warning: My solution is very hacky – my code is crying for a good refactoring. But it works.
TL;DR

- Write a Node.js script that uses the Webpagetest API for running web performace tests
- The Webpagetest API is flexible: You can set test parameters (e.g. network conditions, number of test runs), set cookies and download videos and keyframe screenshots of a page loading
- Write specific web performance metrics to an InfluxDB database running on your local machine
- Display your metrics in Grafana running on your local machine
- Automate testing either with a bash script or a cron job
1. Get InfluxDB Up and Running
In your terminal, if you enter influx with InfluxDB running, you should get the following output:
$ influx
Connected to http://localhost:8086 version v1.7.x
InfluxDB shell version: v1.7.x
Enter an InfluxQL query
>
Now create a new database webpagetest.
> create database webpagetest2. Get a Webpagetest API key
Now get your free Webpagetest API key. With it you can run 200 tests per day – which is more than enough for personal use and small projects.
3. Write a Node.js Script to Run a Webpagetest
You’ll need Node installed on your machine.
Create a document for your Node script and save it as webpagetest.js.
Declare Variables and Include Modules
First off, in webpagetest.js, declare a variable testURL for the URL to the page you want to test, and a variable pageName which you can use to name your test.
// Set the following variables for the page to be tested
let testURL = process.argv[2];
let pageName = process.argv[3];
Include modules and set a few variables for later. Insert your Webpagetest API key in the variable key.
// Modules and other test variables
const WebPageTest = require("webpagetest");
const fs = require("fs");
const download = require("download-file");
const key = "XXXXXXXXXXXXXXXXXXXXXXXXXXXXXXXXXX"; // Insert your key here
const wpt = new WebPageTest("www.webpagetest.org", key);
const Influx = require("influx");
const influx = new Influx.InfluxDB({
  host: "localhost",
  database: "webpagetest",
  port: 8086,
});
module.exports = influx;
let path = "./results/_tmp/";
let videoDownloadURL = "https://www.webpagetest.org/video/download.php?id=";
let filmstripURL_start = "https://www.webpagetest.org/video/filmstrip.php?tests=";
let filmstripURL_end = "-r:1-c:0&thumbSize=200&ival=500&end=visual&text=ffffff&bg=000000";
Set Test Options
The great thing about Webpagetest is how much control you have over how the tests are run.
Speedy pages are especially important on mobile devices in a mediocre mobile network. So I set the test options accordingly and tell Webpagetest to also give me a video of the test page loading and to perform a Google Lighthouse audit:
const testOpts = {
  emulateMobile: true,
  location: "ec2-eu-central-1",
  firstViewOnly: false,
  connectivity: "3GFast",
  pollResults: 5,
  video: true,
  lighthouse: true,
};
Set Cookies
Sometimes you want to see how fast a page loads for a logged-in user or a user with certain settings.
With wpt.scriptToString, you can tell Webpagetest to set cookies and navigate to a specific URL.
const script = wpt.scriptToString([{ setCookie: ["https://www.example.com/", "cookie-consent=true"] }, { navigate: testURL }, "waitForComplete"]);Run a Test
Now comes a monster function, which you sure as hell can refactor. In wpt.runTest() you can a) run tests, b) write test data to InfluxDB, and c) download a test video and filmstrip.
First, call the runTest function on wpt and use script and testOpts as arguments. Then write some messages to the console and declare some variables for later.
wpt.runTest(script, testOpts, (err, result) => {
  if (err) throw err;
  console.log('########################################');
  console.log(err || 'Test successful for ' + testURL);
  let date = result.data.completed;
  let fileName = path + date + " - " + pageName + '.json';
  let testID = result.data.id;
  console.log('Test ID: ' + testID);

  let stats = JSON.stringify(result.data, null, 2);
You can optionally save the results of the Webpagetest and Lighthouse audit as JSON to a local directory.
// Optional for saving JSON test results to a local directory
fs.writeFile(fileName, stats, (err) => {
  if (err) throw err;
  console.log("Data for " + pageName + "written to file: " + fileName);
});
Write Test Results to InfluxDB
Still within the monster runTest function, you set and declare variables that are used for writing test results to InfluxDB.
// Variables for writing test results to InfluxDB
date *= 1000000000;
let firstView = result.data.runs["1"].firstView;

// The metrics you want to monitor
let firstMeaningfulPaint = firstView.firstMeaningfulPaint;
let loadTime = firstView.loadTime;
let firstInteractive = firstView.FirstInteractive;
let bytesInDoc = firstView.bytesInDoc;
let requestsDoc = firstView.requestsDoc;
let fullyLoaded = firstView.fullyLoaded;
Then call method writePoints on influx that writes those metrics to your Influx database.
// Call a method that writes test results to InfluxDB
influx
  .writePoints([
    {
      measurement: "webpagetest",
      tags: {
        pageName: pageName,
        run: 1,
      },
      fields: {
        firstMeaningfulPaint: firstMeaningfulPaint,
        timeToInteractive: firstInteractive,
        bytesInDoc: bytesInDoc,
        fullyLoaded: fullyLoaded,
        requestsDoc: requestsDoc,
        loadTime: loadTime,
      },
      timestamp: date,
    },
  ])
  .then(() => {
    return influx.query(`
        select * from webpagetest
        order by time desc
        `);
  })
  .catch((err) => {
    console.error(`Error creating Influx database!`);
  });
Optionally Download Video and Filmstrip
You can download an MP4 video and a “filmstrip” of the page loading.
  // Video Options
  var videoOptions = {
    directory: path,
    filename: date + " - " + pageName + ".mp4"
  }

  // Filmstrip options
  var filmstripOptions = {
    directory: path,
    filename: date + " - " + pageName + ".png"
  }

  // Method to create video of the page loading
  wpt.createVideo(testID, testOpts, (err, data) => {
    console.log(err || data);
    let videoId = data.data.videoId;
    videoDownloadURL += videoId;

    setTimeout(function () {
      download(videoDownloadURL, videoOptions, function (err) {
        if (err) throw err;
        console.log('########################################');
        console.log("Video download URL for " + pageName + ": " + videoDownloadURL);
        console.log('########################################');
      })
    }, 5000);

    // Download the filmstrip
    var filmstripURL = filmstripURL_start + testID + filmstripURL_end;

    download(filmstripURL, filmstripOptions, function (err) {
      if (err) throw err;
      console.log('########################################');
      console.log("Filmstrip download URL for " + pageName + ": " + filmstripURL);
      console.log('########################################');
    })

  });
});
4. Set Up Grafana
Download and install Grafana, then open http://localhost:3000 in your browser.
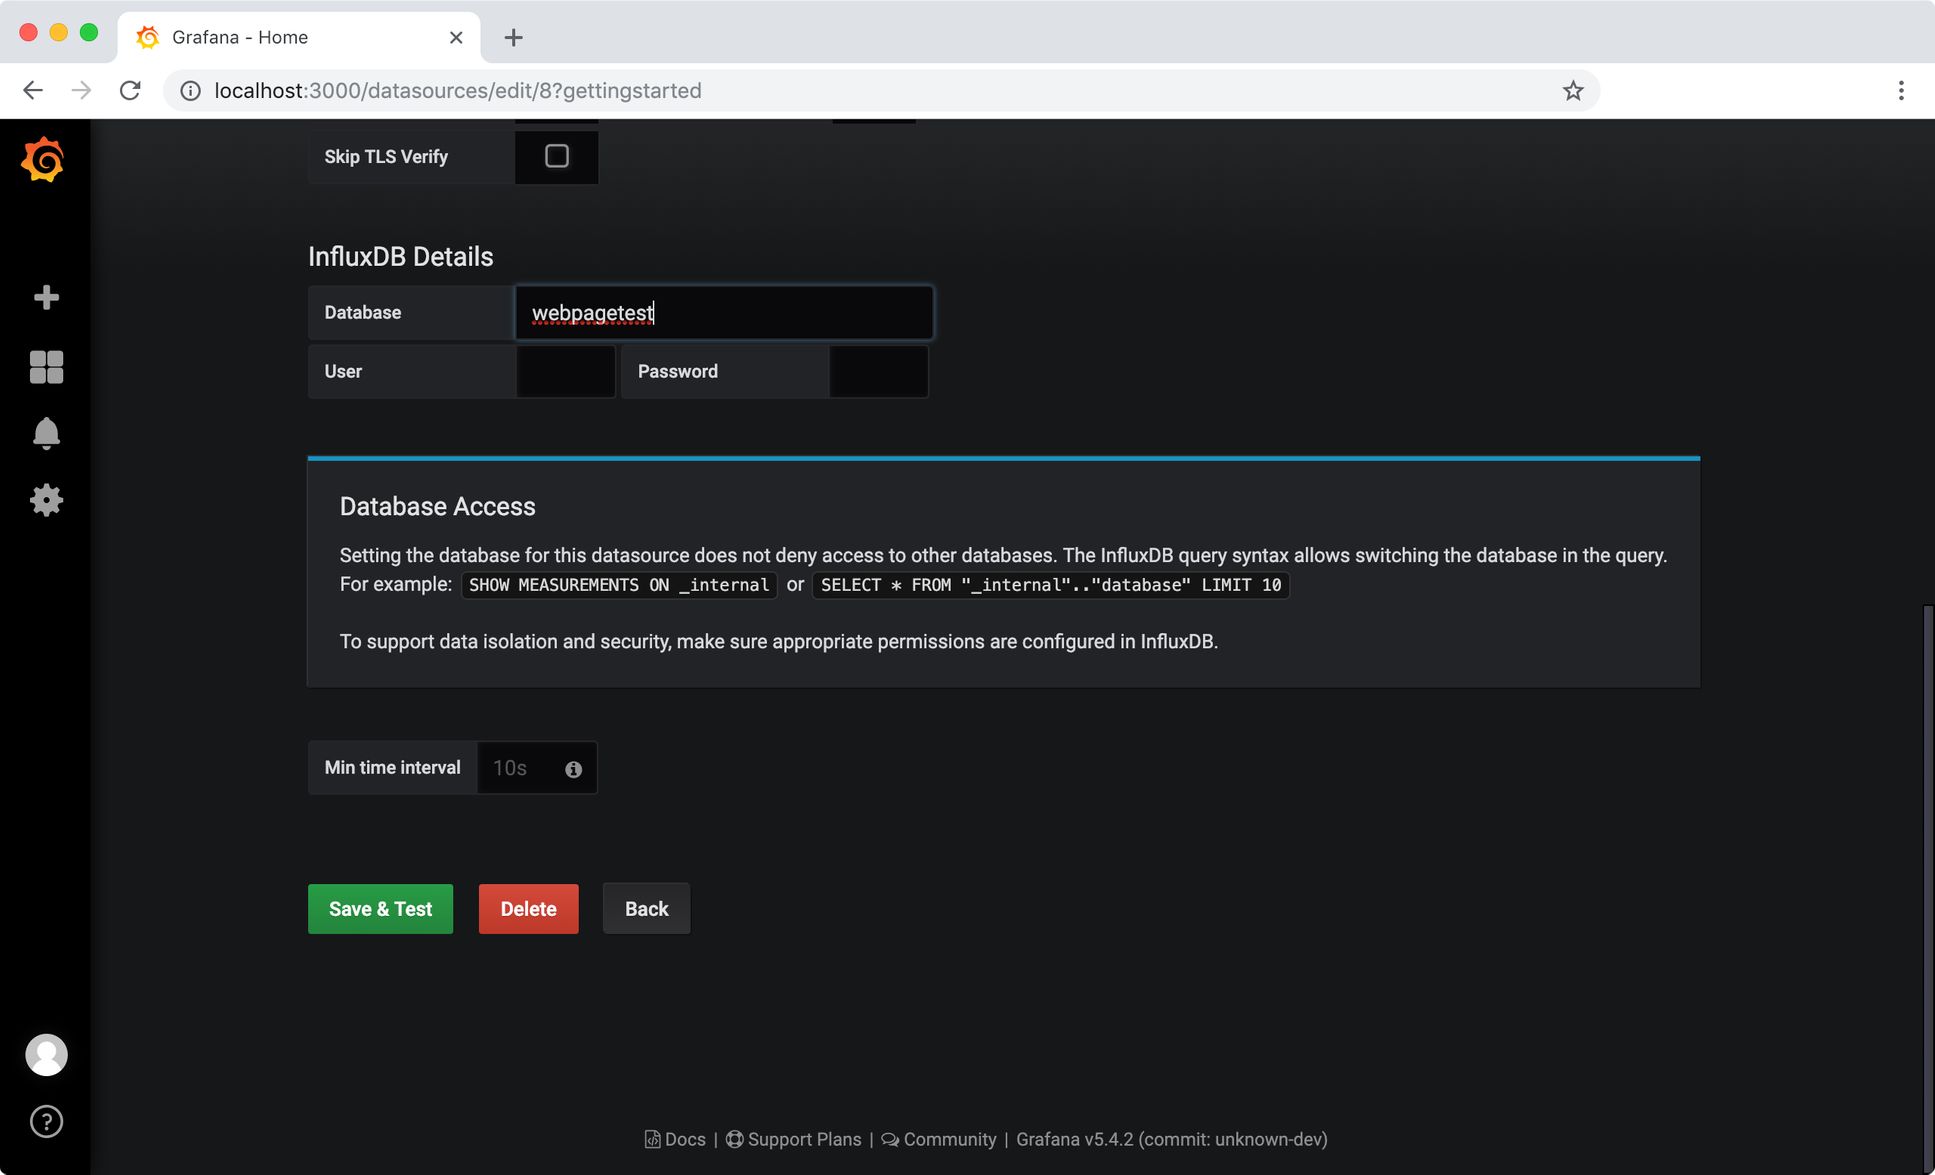
Set up InfluxDB as your data source
Choose InfluxDB as your data source type, then set http://localhost:8086 as the URL.
Under “InfluxDB Details”, select webpagetest to use as the database.
Click “Save & Test” at the bottom of the page.
Create a new dashboard and add a graph
Go over to your “Home Dashboard” and click on “Create your first dashboard”. A new dashboard will open.
Then click on “Graph” to add a graph to a new panel.
Select metrics for the graph

Click on “Panel Title” above the empty graph, then select “Edit”.
In the “Data Source” dropdown, select InfluxDB.
Now, add a query next to the “A” that will display a metric for a specific page.
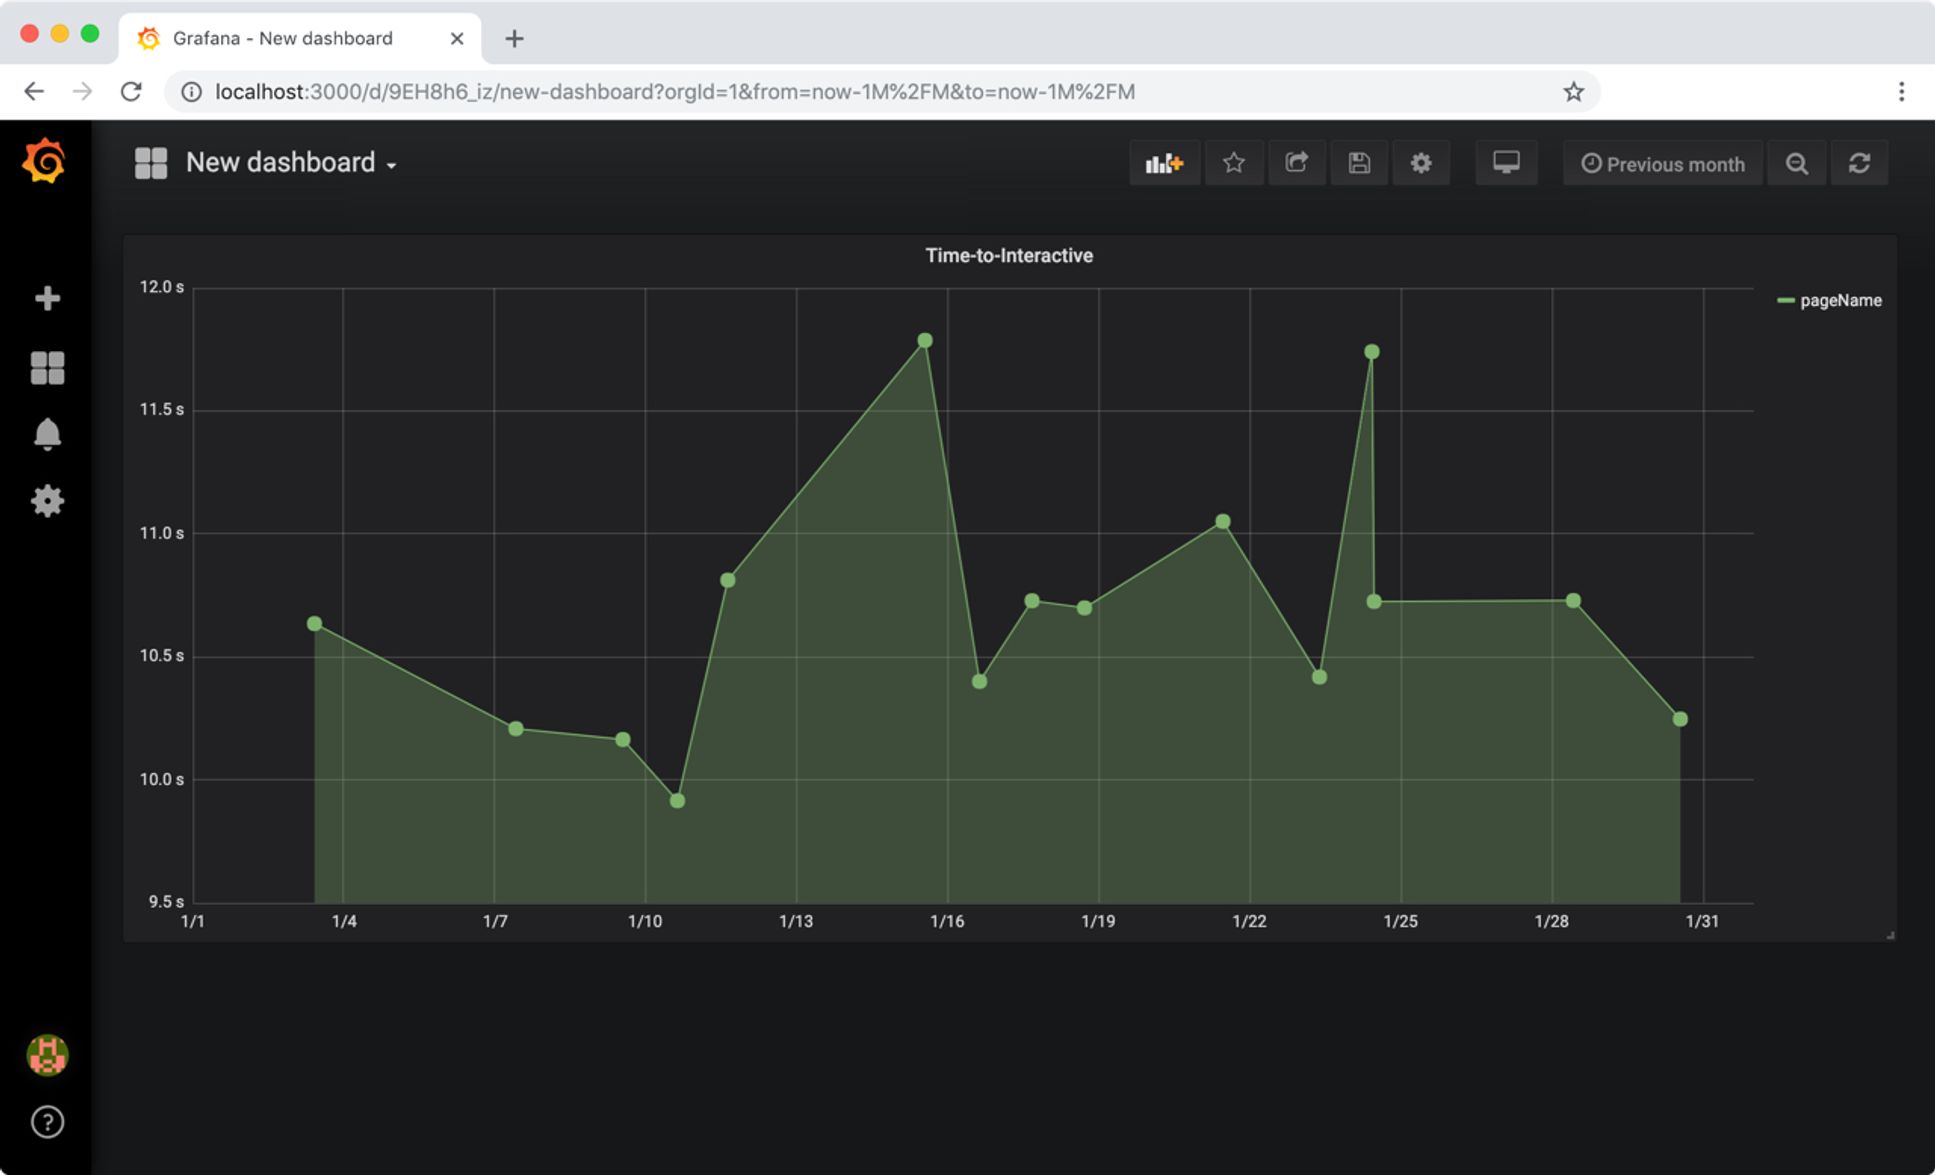
For example, if you want to see how the Time-to-Interactive for Page A progresses over time, use a query like this:
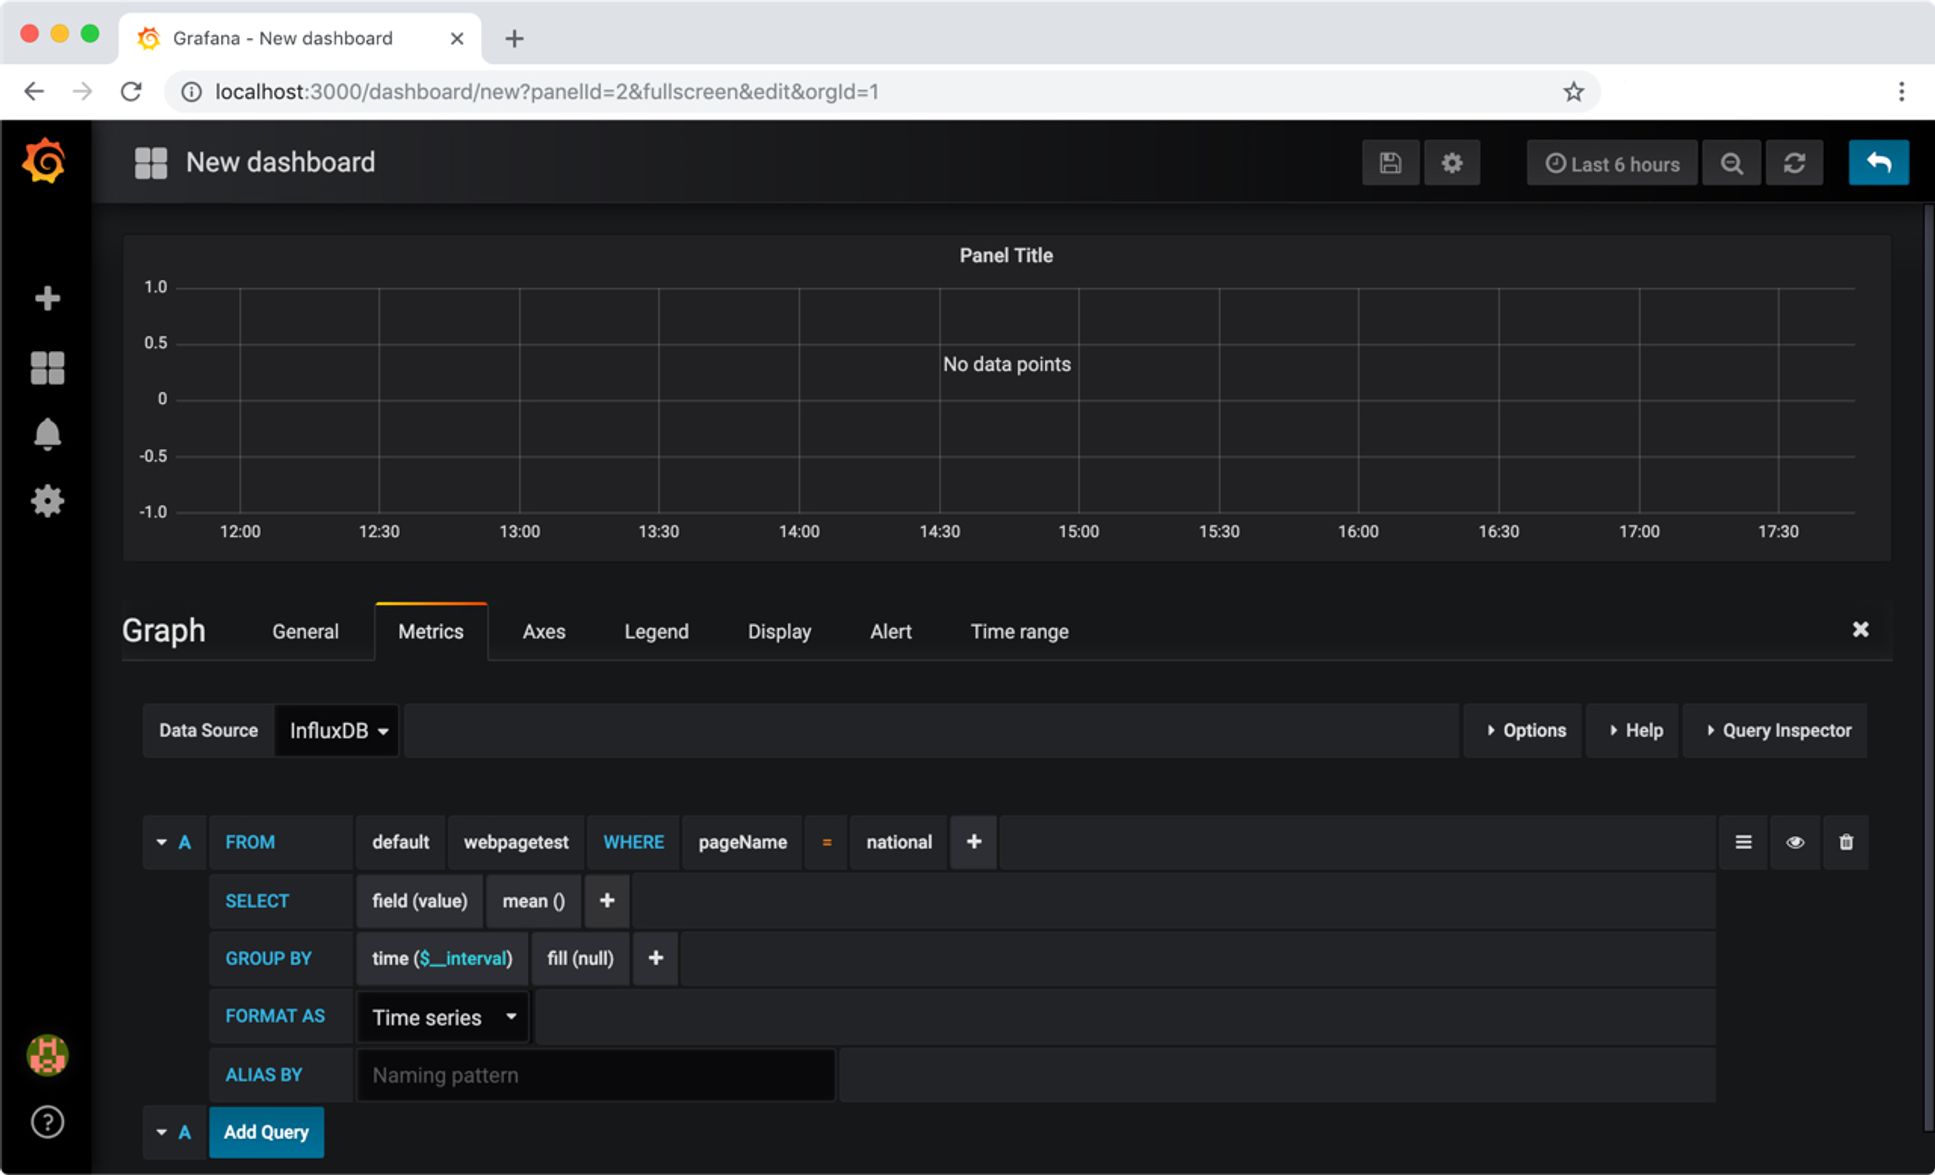
To get rid of the default “mean()” attribute from time($_interval), click on it and select “remove.” Then you can click the plus icon and select the attribute “last()”.
Feel free to duplicate queries and change the pageName for each page you want to display in the graph.
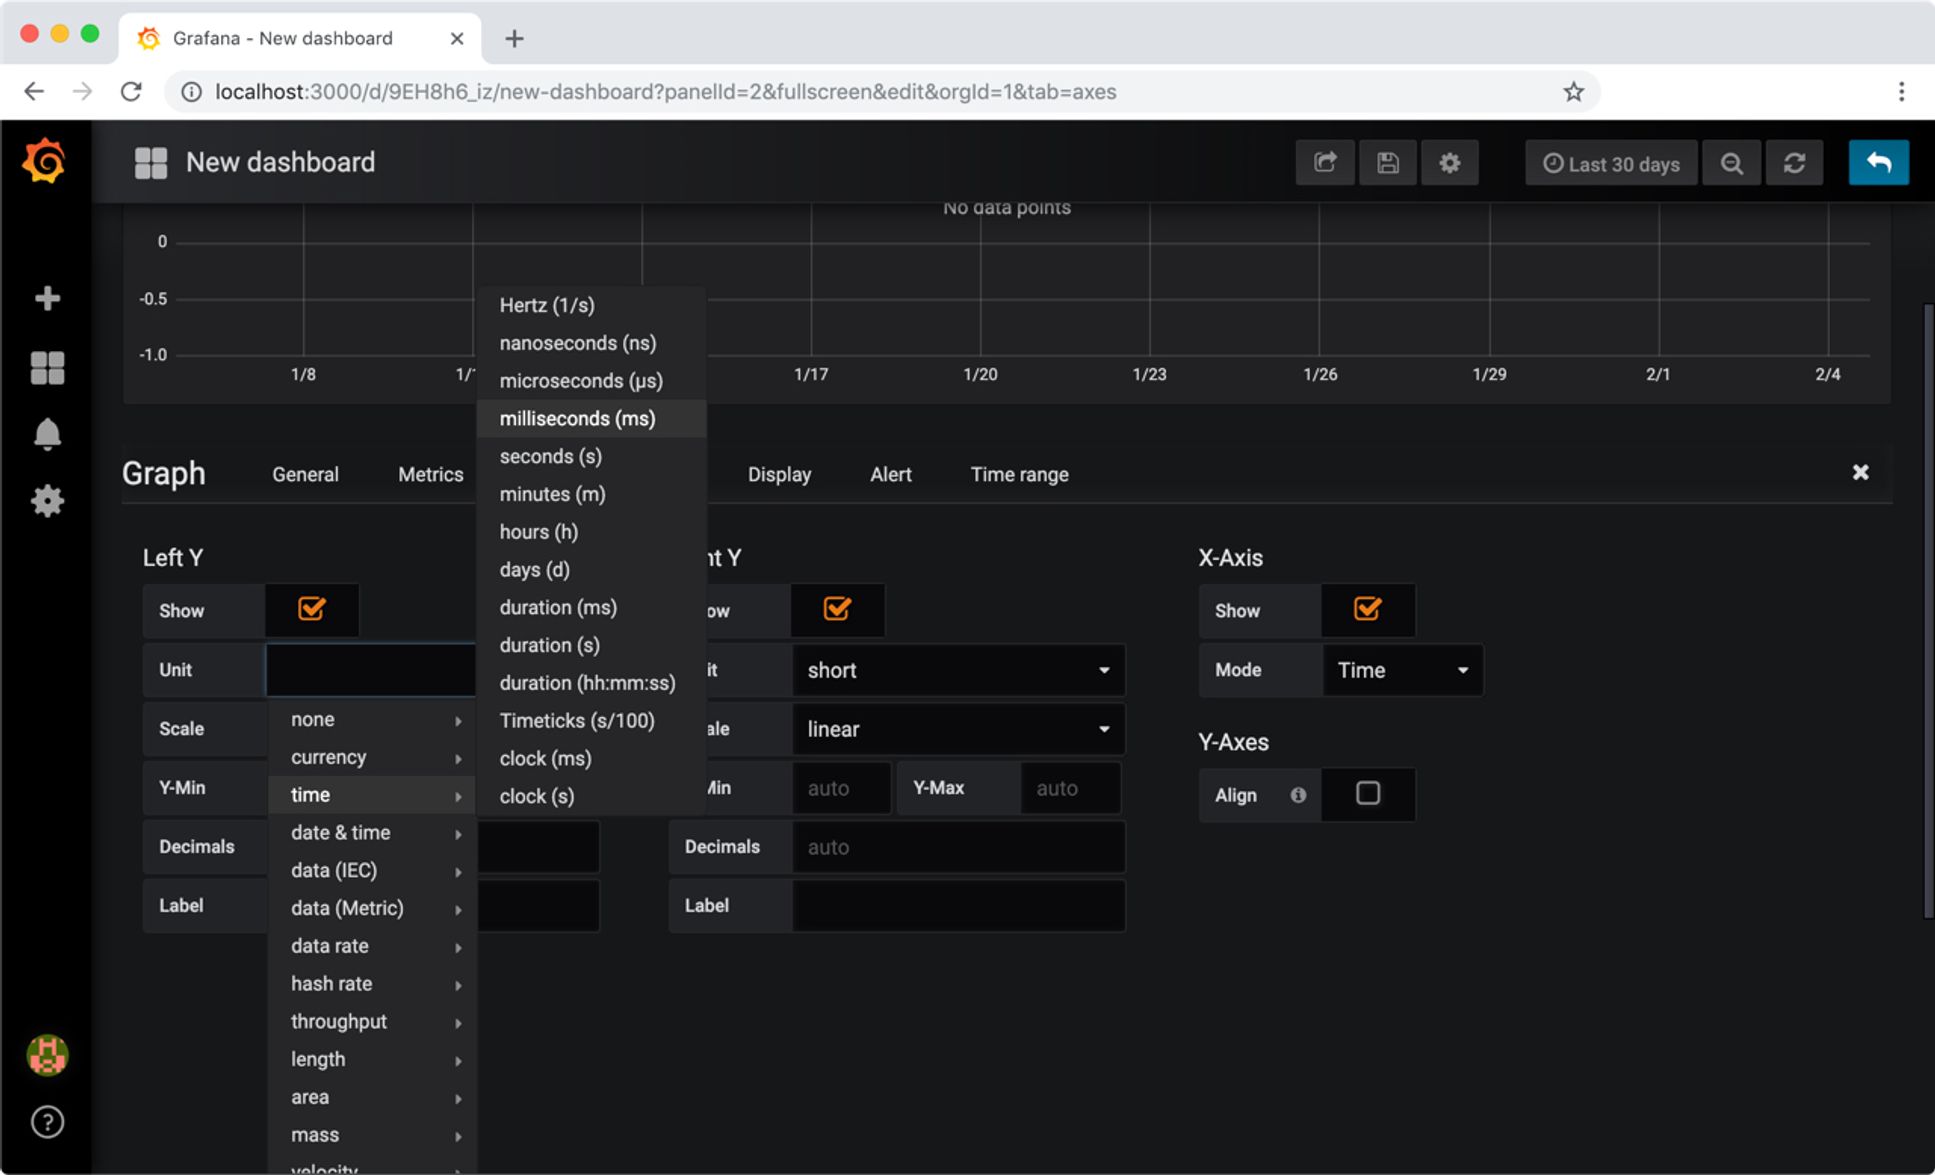
Edit Axes and Display settings
In the Axes panel, select “milliseconds (ms)” for “Unit”.
In the Display panel, make sure “Null value” is set to “connected”.
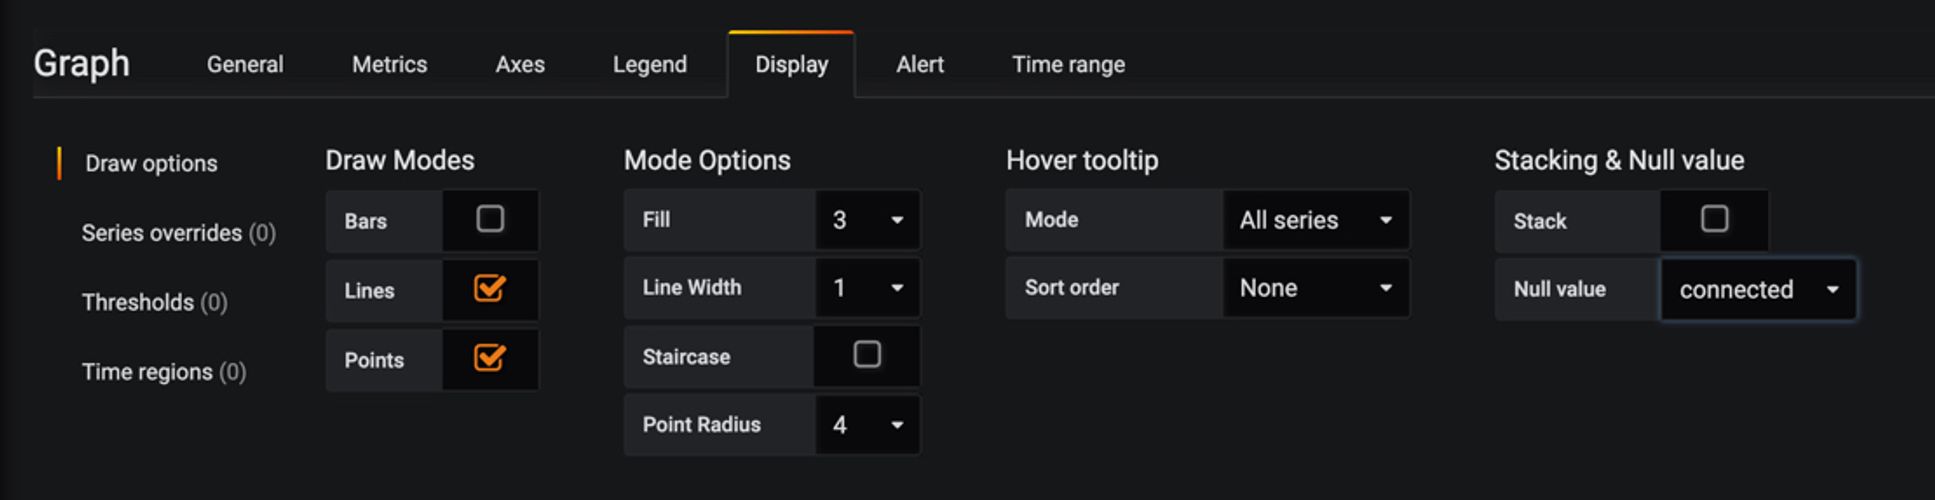
Then click on the little “x” to exit Edit mode, make sure the time range includes your data points, and save your dashboard.
Voila!
5. Automate Testing
You can run single tests via command line by calling webpagejest.js and adding a URL and a “page name” (how you want to label test output):
$ node webpagetest.js "https://www.example.com/page-name" pageNameI run multiple tests in a bash script, adding additional commands with other URLs and page names:
#! /bin/bash

# Move to the directory where 'webpagetest.js' is located
cd /Users/<user>/webpagetest/

# Run a test per page
node webpagetest.js "https://www.example.com/page-name-1" pageName1 &
node webpagetest.js "https://www.example.com/page-name-2" pageName2 &
node webpagetest.js "https://www.example.com/page-name-3" pageName3
That bash script can be executed either by setting up a cron job or using Automator on Mac.
Credits
A huge thanks to Oliver Bacher for suggesting using InfluxDB and Grafana for saving and displaying data!