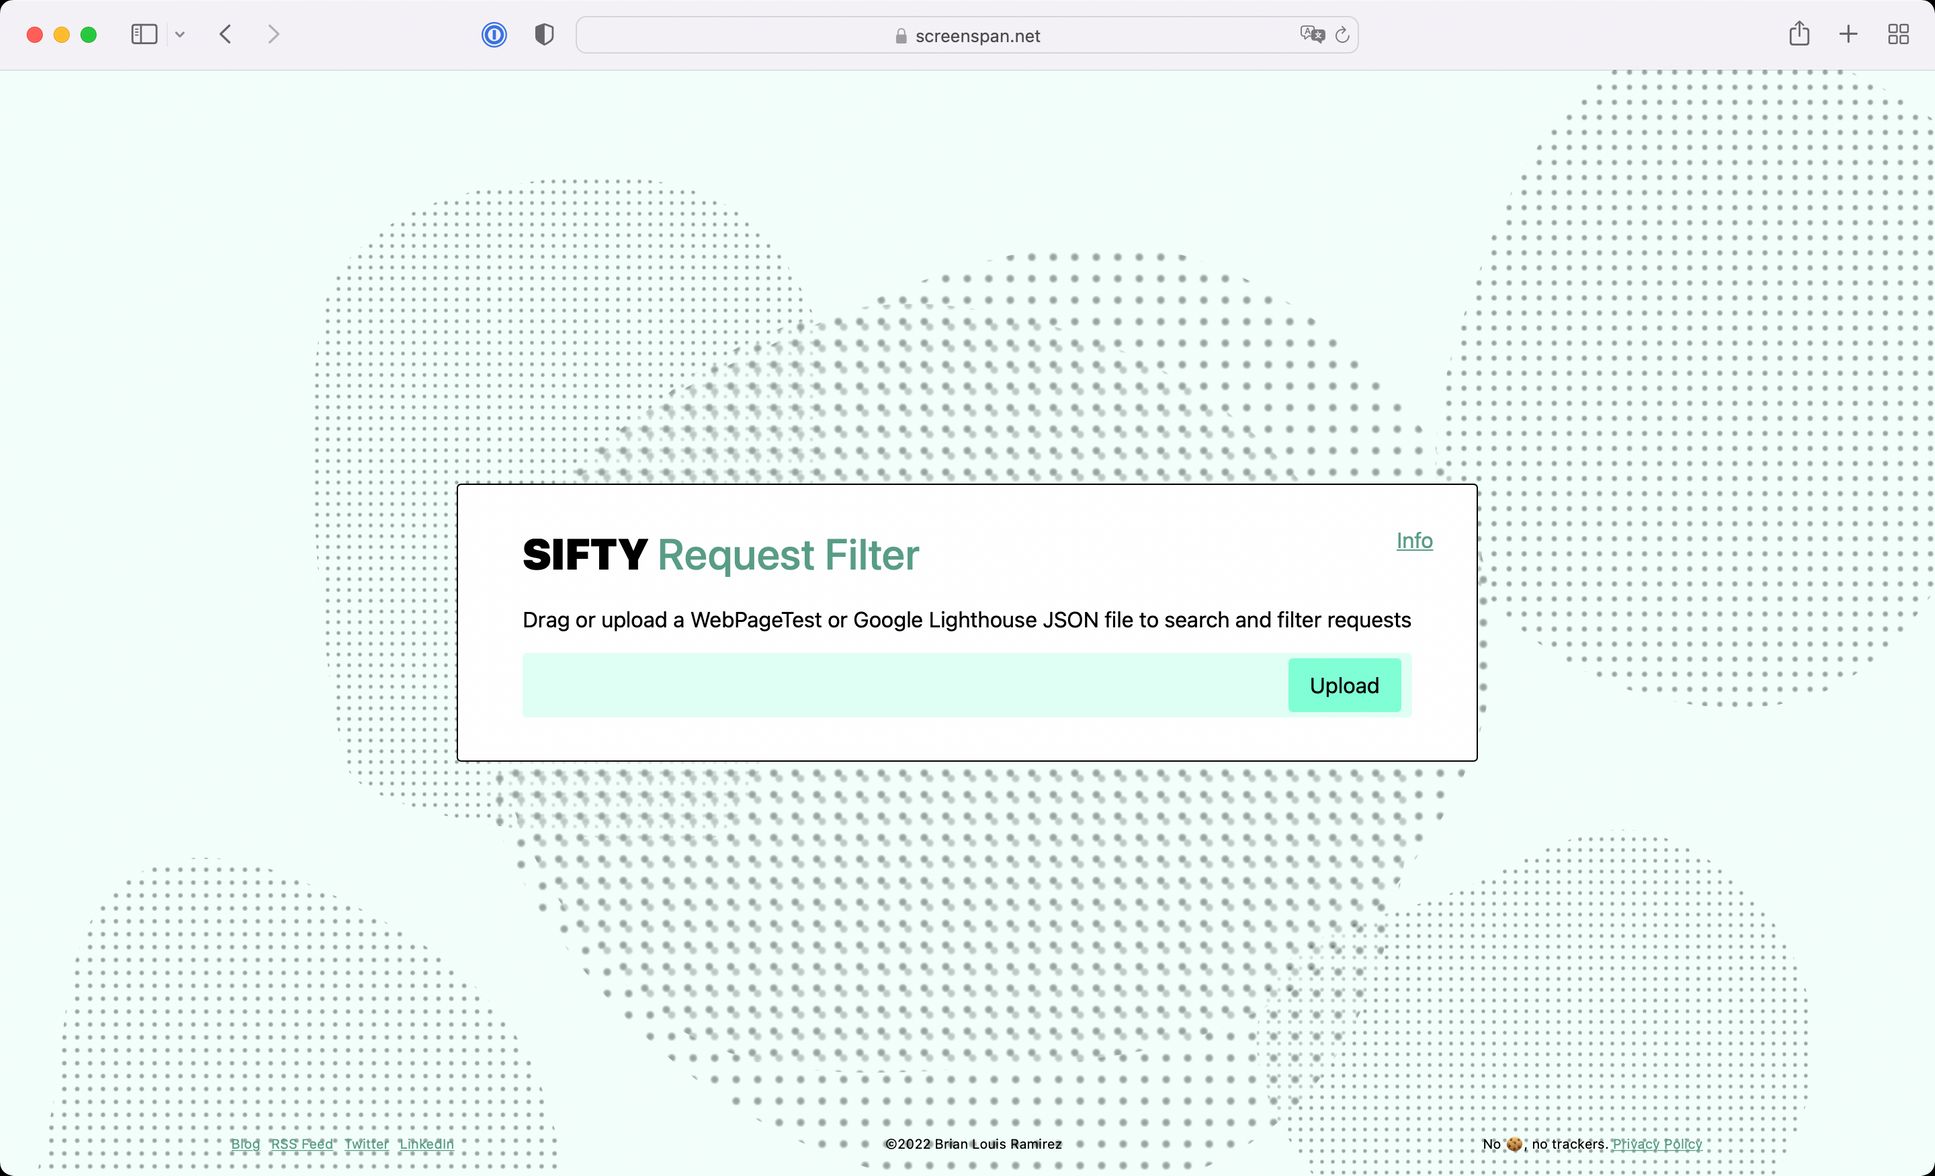
Sifty is a simple web app that lets you parse WebPageTest and Google Lighthouse JSON test results files so you can “sift through” network requests by URL, whether they block rendering or sort them by bytes transferred.
The data you “upload” into Sifty is processed immediately by the browser and is not uploaded to any servers. If you move away from the page, any data you have uploaded will be gone.
You can save all or selected requests as a CSV file so you can compare the requests from multiple test results. That can help you answer questions such as:
- How many bytes or requests did I save?
- How many bytes of render-blocking content did I save?
- How many Stylesheets did we have before and after?
Getting started with WebPageTest
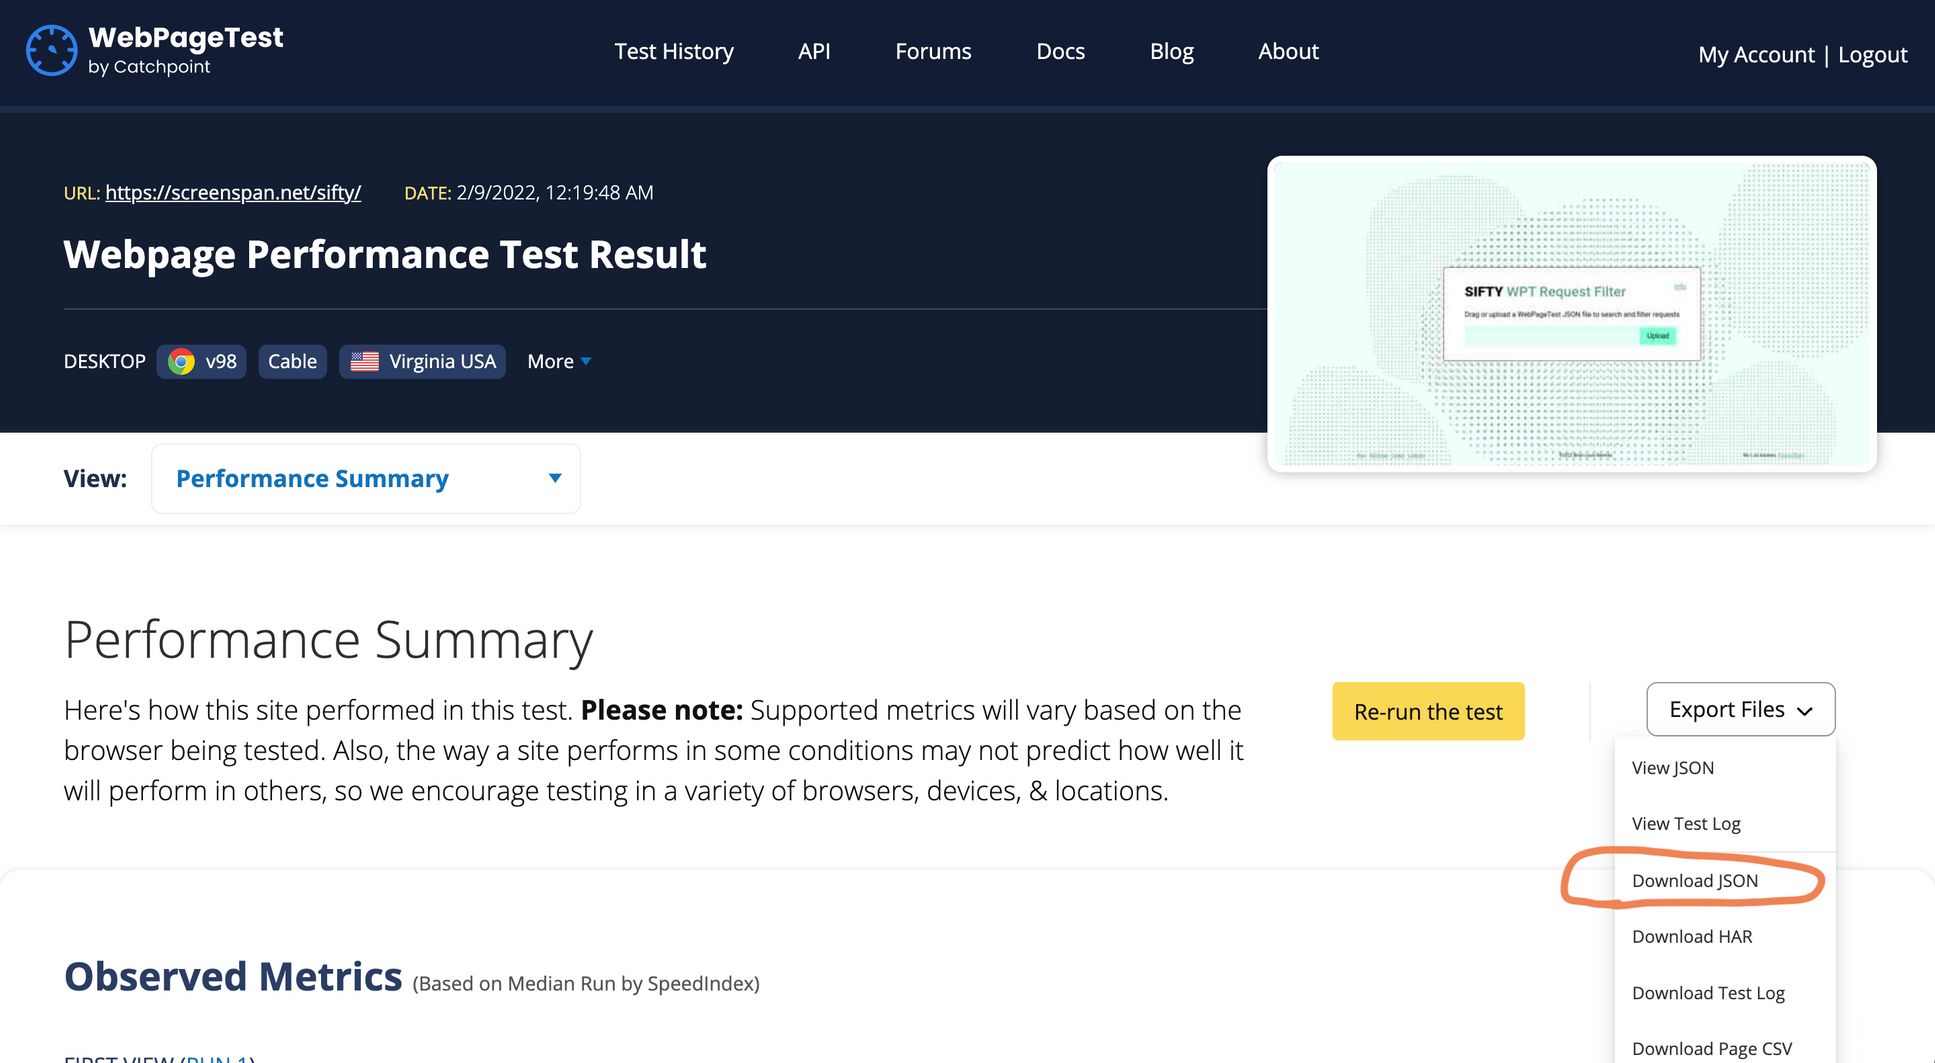
Run a test on WebPageTest or open a previously run test from your Test History.
In the Summary view of a test, download the results as JSON.

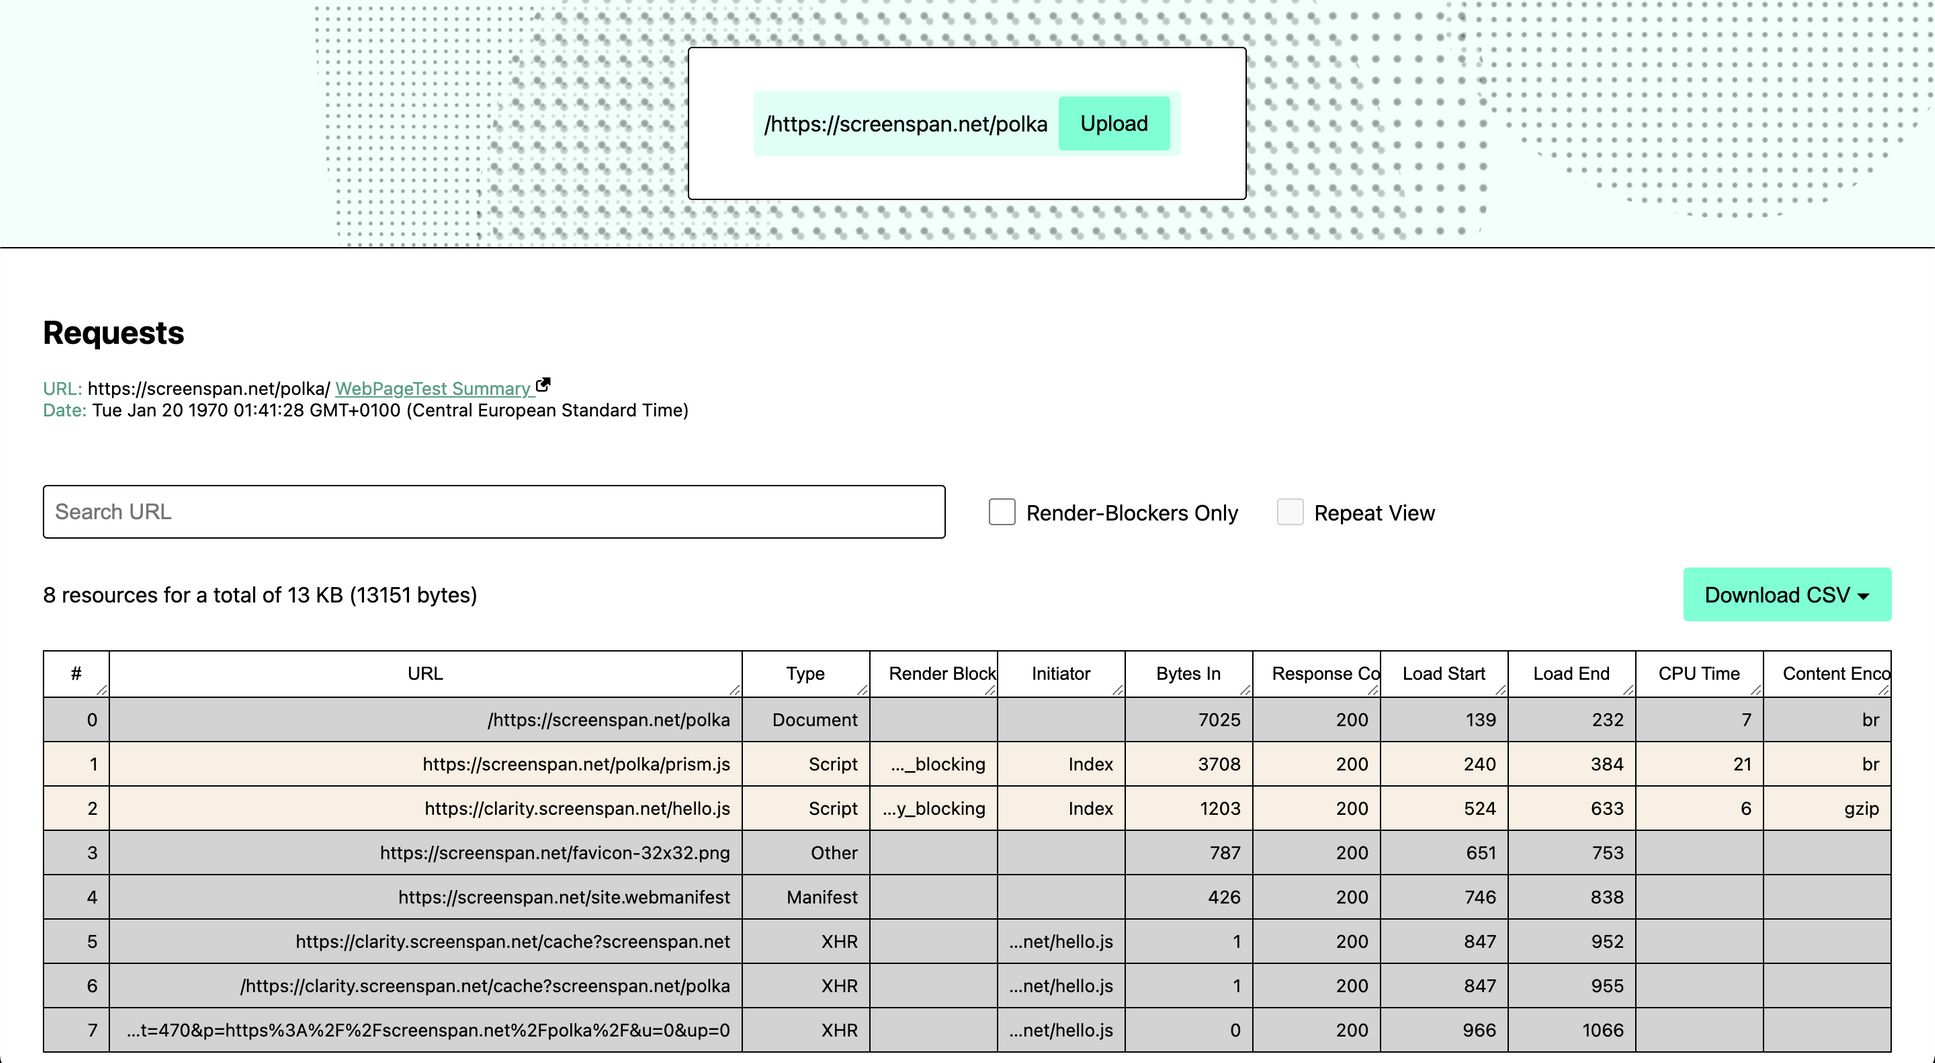
Upload the JSON file to Sifty. Network requests for the median first view are displayed.

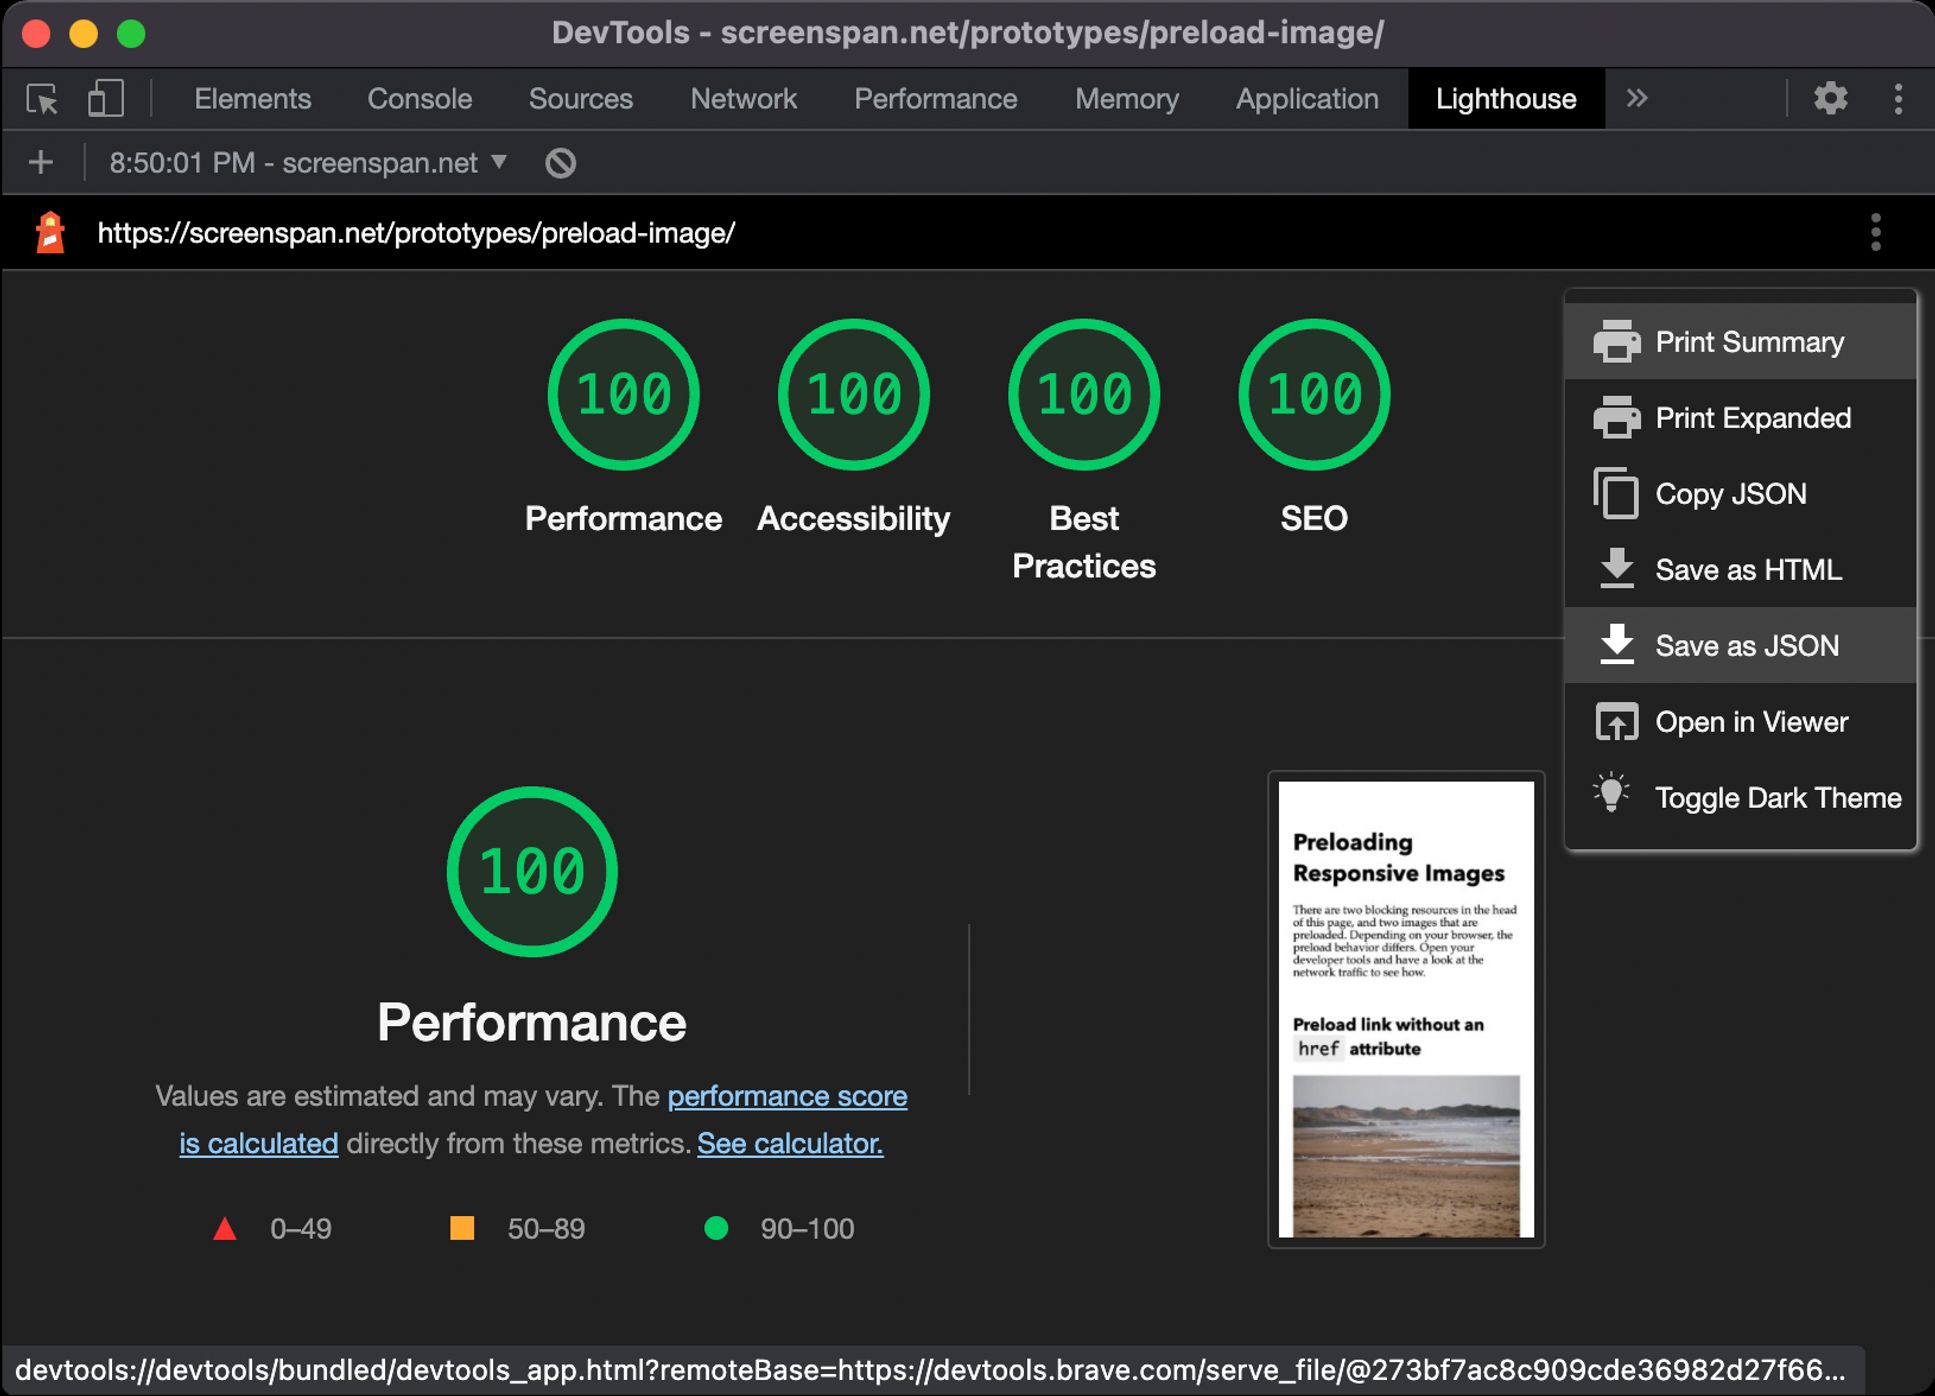
Getting started with Google Lighthouse
Open your test page in a Chromium browser, open developer tools and to to the “Lighthouse” tab – or visit web.dev/measure – and run an audit.
Save the result as JSON.

Upload the JSON file to Sifty.
Using Sifty
- Filter requests by URL using the search bar. Enter
headerfor example to display any requests containing that string in the full URL. You can also combine search terms using the pipe character (|), e.g..css|.jsto list stylesheets and scripts. - Display requests for the median repeat view (if repeat-view tests were run).
- Filter requests by “render blocking” or “potentially render blocking”.
- Sort requests by clicking on the table headers.
- Export filtered or all requests as CSV for further use; but not all data from the JSON file is exported.
- The original
"requests"node from the WebPageTest JSON file is logged to console as well as all the data for the selected requests.
Why I built Sifty
Perhaps the single most important strategy for making webpages load faster is:
Keep request counts low and transfer sizes small
- Google Lighthouse
When I audit a webpage’s performance, one of the first things I do is: empty my browser cache, load the page and view the network traffic using a browser’s developer tools. That lets me quickly determine a) the page weight (i.e. number of bytes) transferred, b) the number of requests, c) which types and sizes of resources are being downloaded, cached and compressed, d) which resources load upon interaction, and so on.
And that works fine if you’re looking about a page’s status quo loading behavior. But what about changes over time – when you can’t inspect the network traffic of a page that has undergone changes?
With WebPageTest, you can find a treasure trove of information on a page’s request details by looking at its waterfall chart. And because test results are saved, you can compare tests and review changes over time.
I found myself frequently parsing WebPageTest JSON results using Python to search for request types or URLs containing certain strings. So I tinkered around with a web UI to do just that. Think of Sifty as a bit of a mix between dev tools’ network requests panel and WebPageTest’s Connections view.
If you give Sifty a try, let me know what you think!