A workmate of mine was once trying to order something our a website, but was unable to log into his account. He had spotted the problem using Developer Tools: a third-party script was slow to load. He let me know about the problem and I tried to reproduce the bug.
At first I was able to log into my account without a problem. But then I re-tried it several times throughout the day and behold!: a request to a third-party domain was laggy, and clicking the login button did nothing.
Then I ran some single-point-of-failure tests by modifying my hosts file and sending requests to WebPageTest’s black hole server to to simulate a laggy response for the third-party resource: the call indeed blocked interaction in a critical part of the user journey. Panic! I reported the incident and the offending script was quickly removed. What a relief!
But the next day, it hit me:
Removing one slow third-party might solve a particular problem on one page. But how do slow responses from third-party domains affect other pages in general?
The HTTP Archive Web Almanac says that over 94% of websites use third-party content. And in light of outtages from Internet giants such as Facebook, Cloudflare and Fastly in recent years, it makes sense to check the performance impact of third-party resources on your site.
In this article, I’ll share with you how I simulate slow responses using Puppeteer.
Find domains or request URLs to throttle
First off, which request URLs or domains can you test?
As perf expert Harry Roberts says, “your <head> is the single biggest render-blocking part of your page”. So look there for third-party:
- stylesheets (e.g.
<link rel="stylesheet" href="https://some-third-party-domain/theme.min.css">) - script tags that don’t have the
deferattribute (e.g.<script src="https://some-third-party-domain.js"></script>) - module scripts missing the
asyncattribute (e.g.<script type="module" src="https://some-third-party-domain.js"></script>)
But don’t stop there! Synchronously-loading third-party scripts may also block other important first-party scripts from executing if they’re further up in the DOM, as in the example I pointed out at the start of this post.
You can view the requests for page resources in your browser’s developer tools. But some pages load lots of third-party ads and trackers.
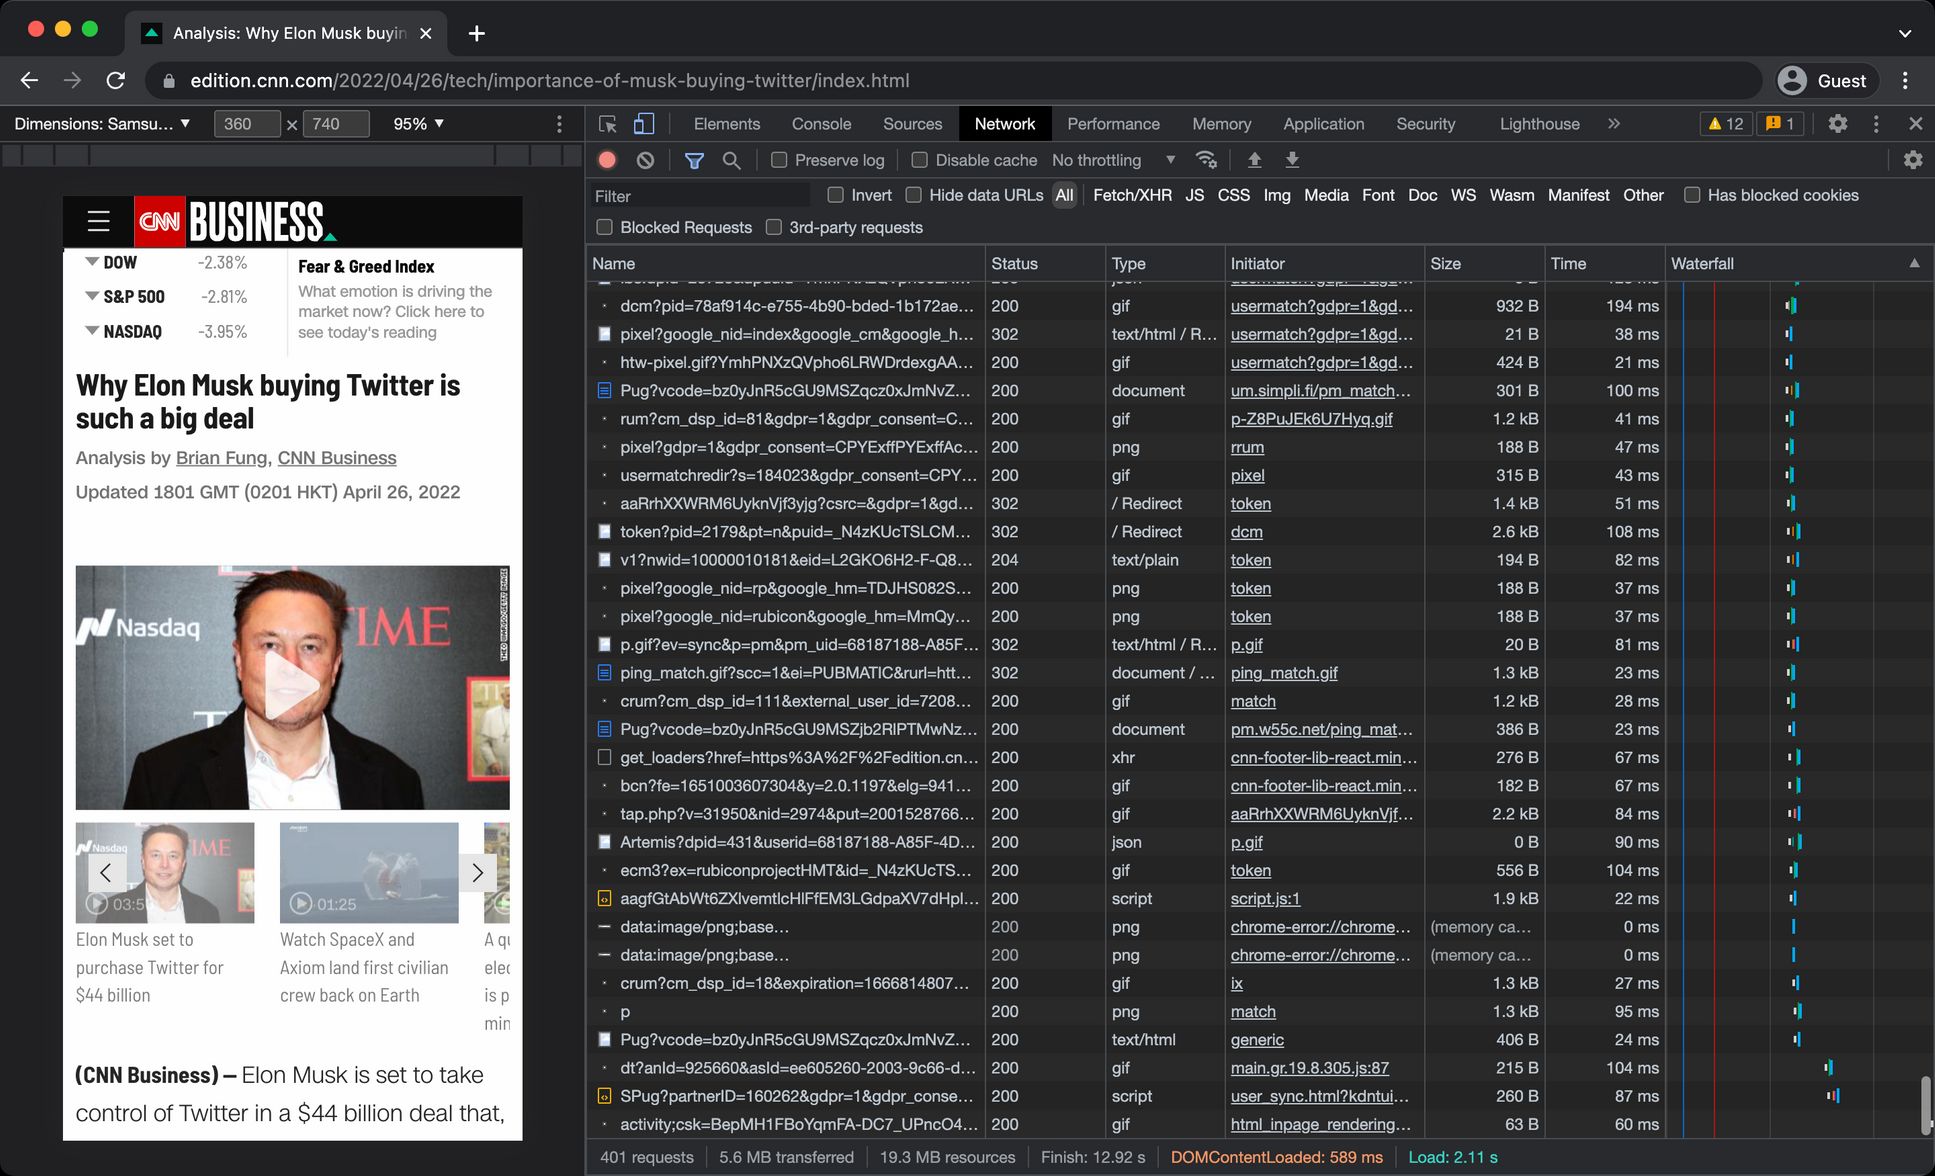
An easier way to list all request domains and subdomains on a given page is by leveraging the Resource Timing API and running this script in the browser console:
try {
  const re = /(?<=\w+:\/\/)[^\/]+(?=\/)/;
  let items = new Set();
  const observer = new PerformanceObserver((entryList) => {
    for (const entry of entryList.getEntries()) {
      let item = re.exec(entry.name)[0];
      items.add(item);
    }
  });
  observer.observe({ type: 'resource', buffered: true });
  // Perhaps there's a better way to do the following!
  setTimeout(() => {
    console.log(items);
  }, 2000);
} catch (e) { console.log(e) }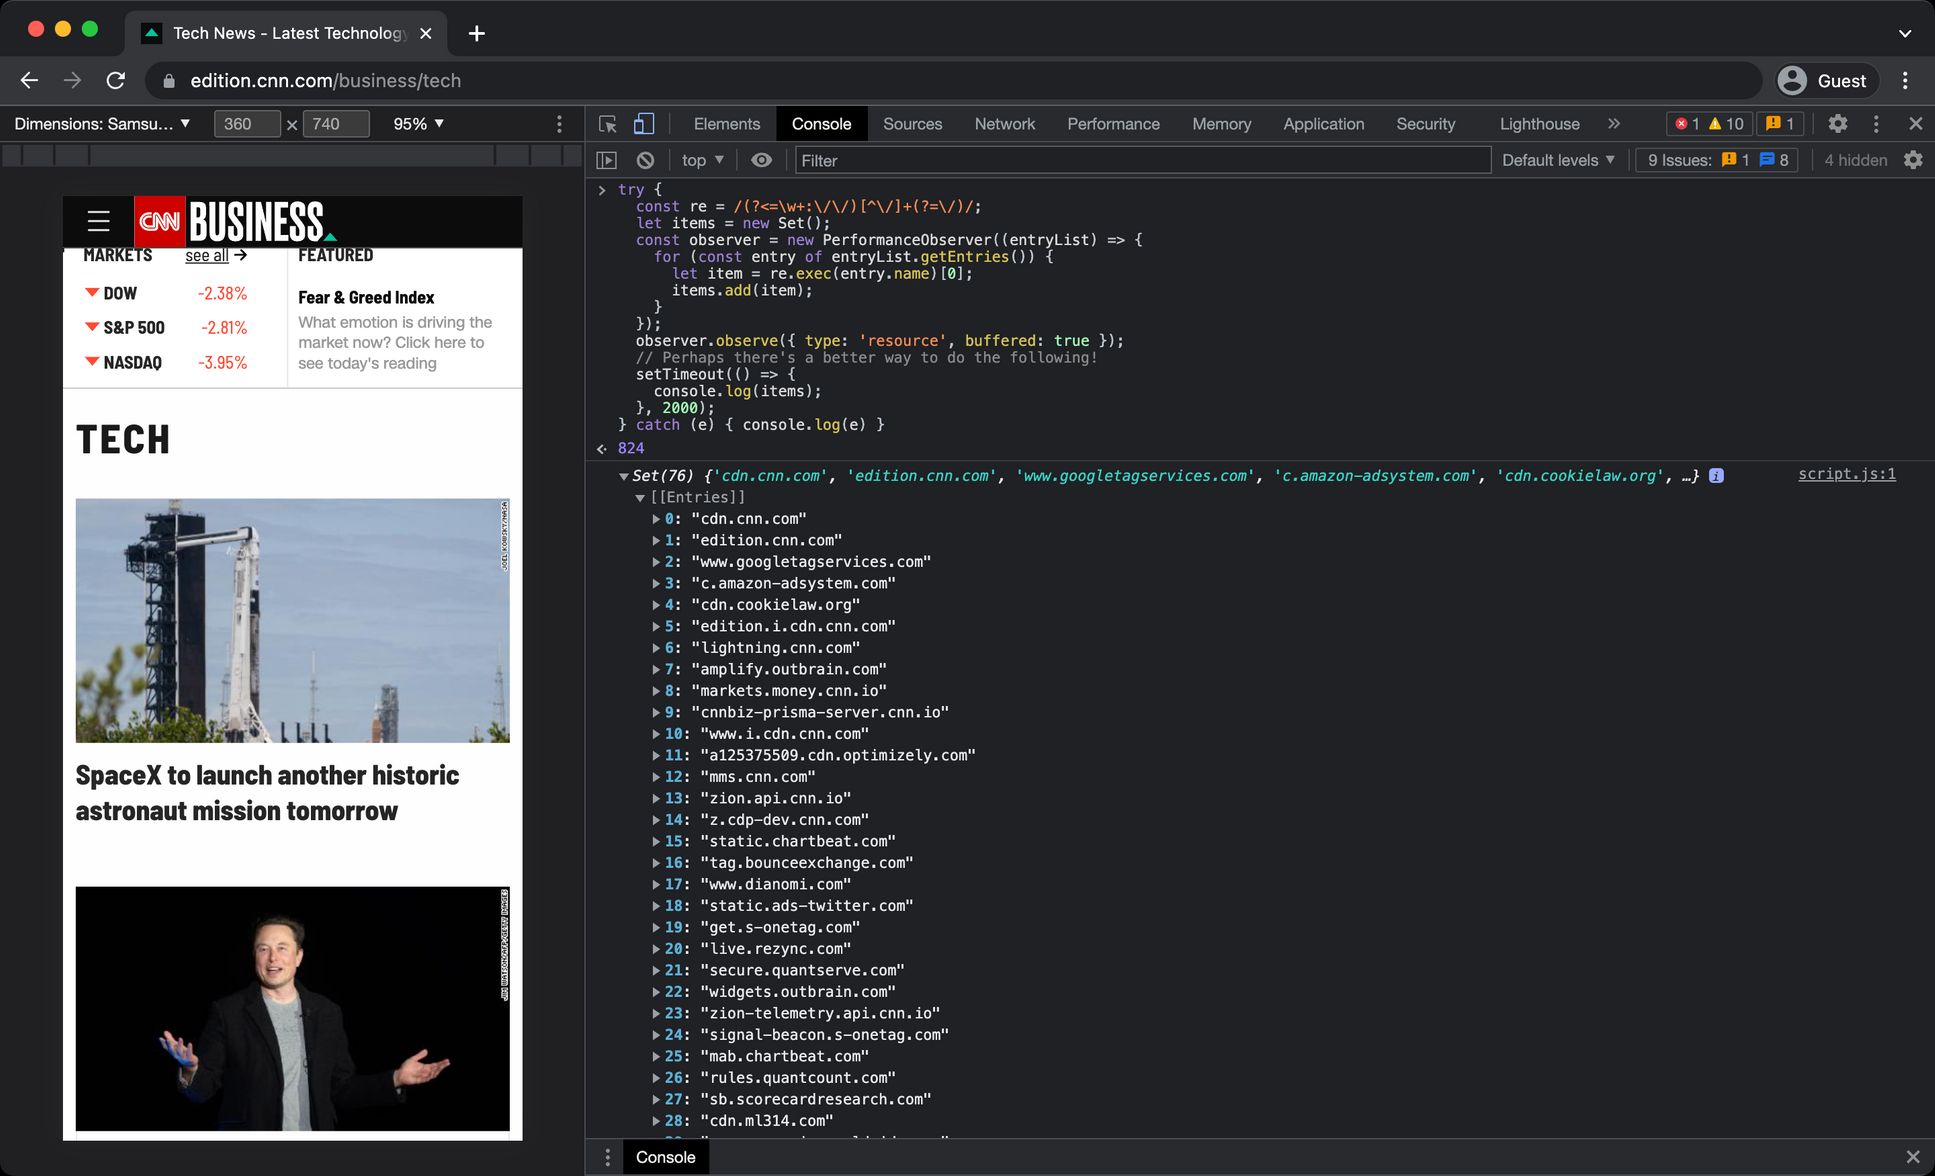
Some ways to throttle network traffic
Now that you know which domain(s) a page sends requests to, how to simulate slow responses from them?
You could throttle your entire network either in your browser’s developer tools or with a network shaper such as Charles or Network Link Conditioner. But that just blankets all loading – even for first-party resources.
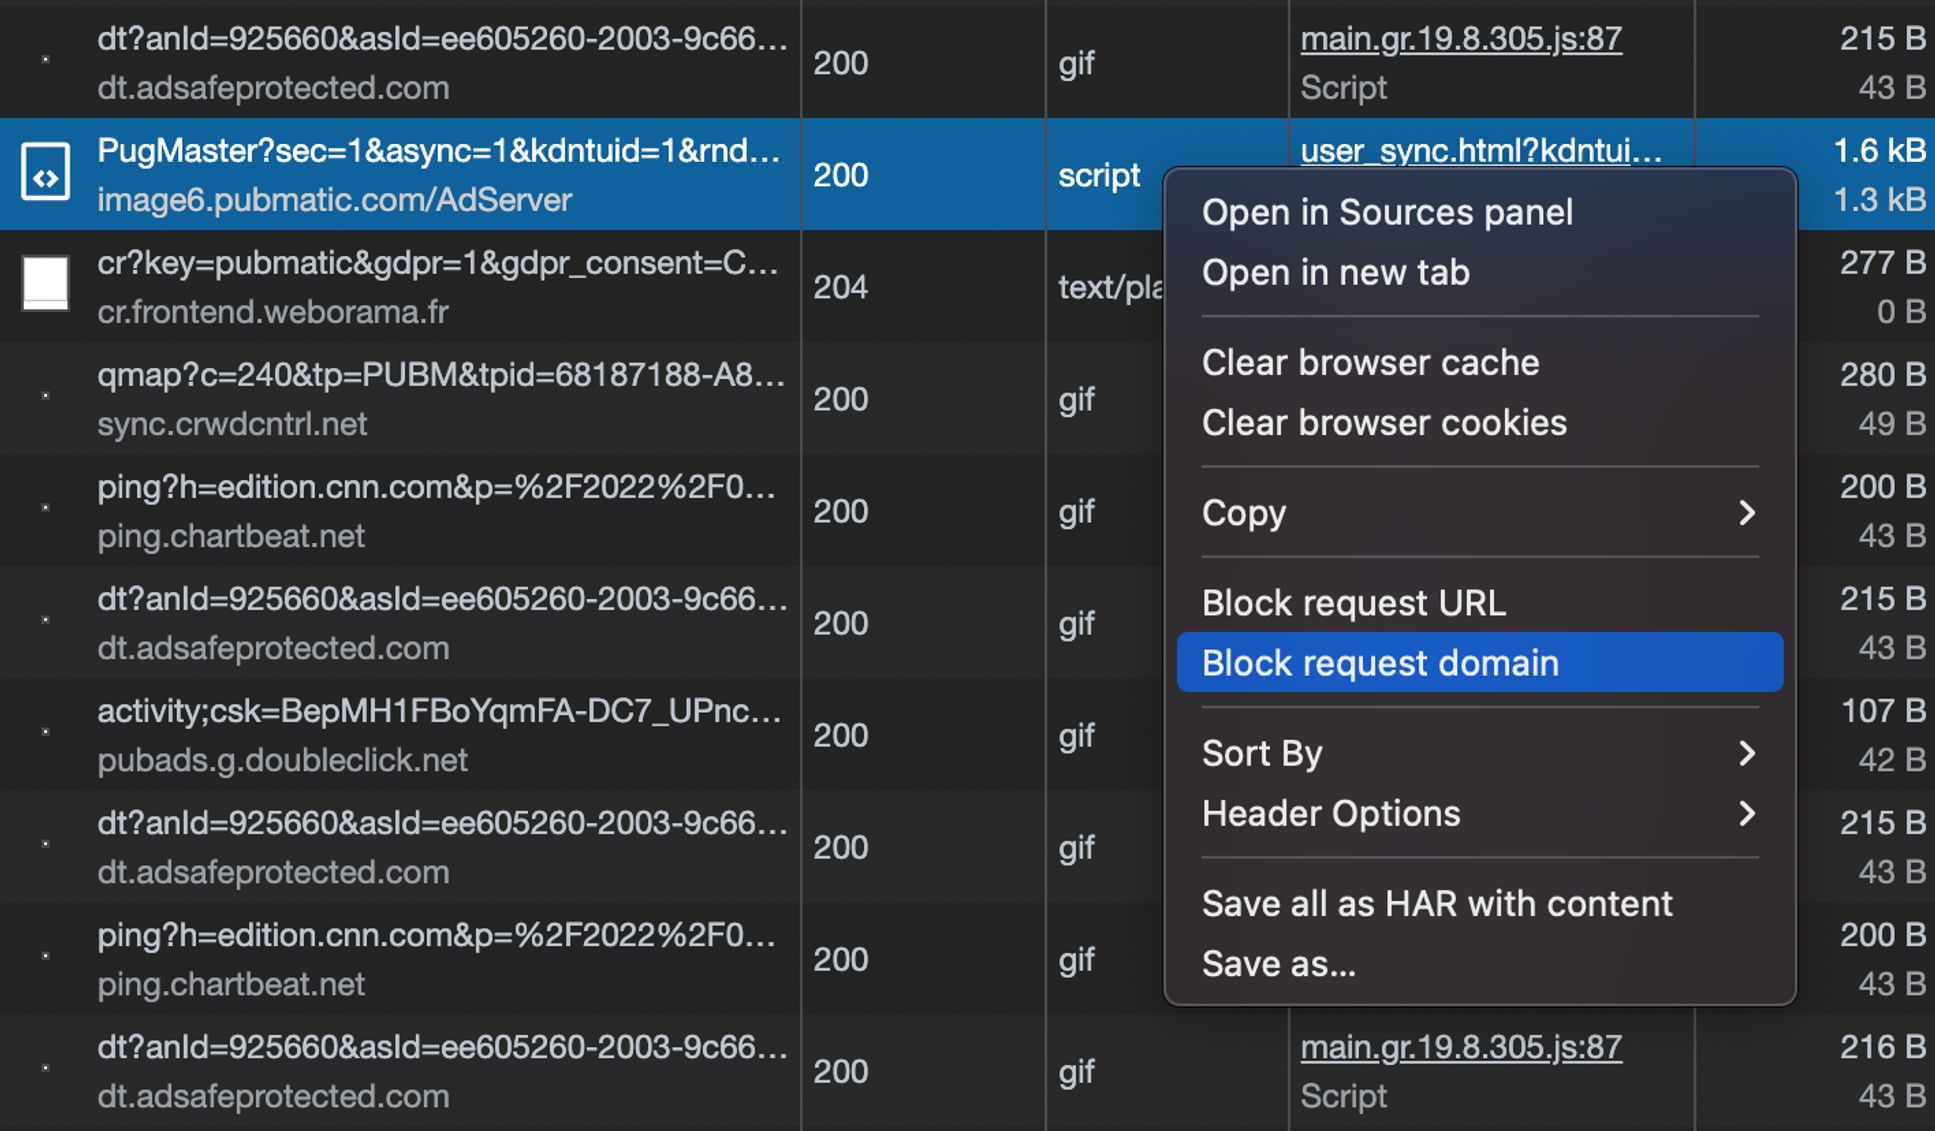
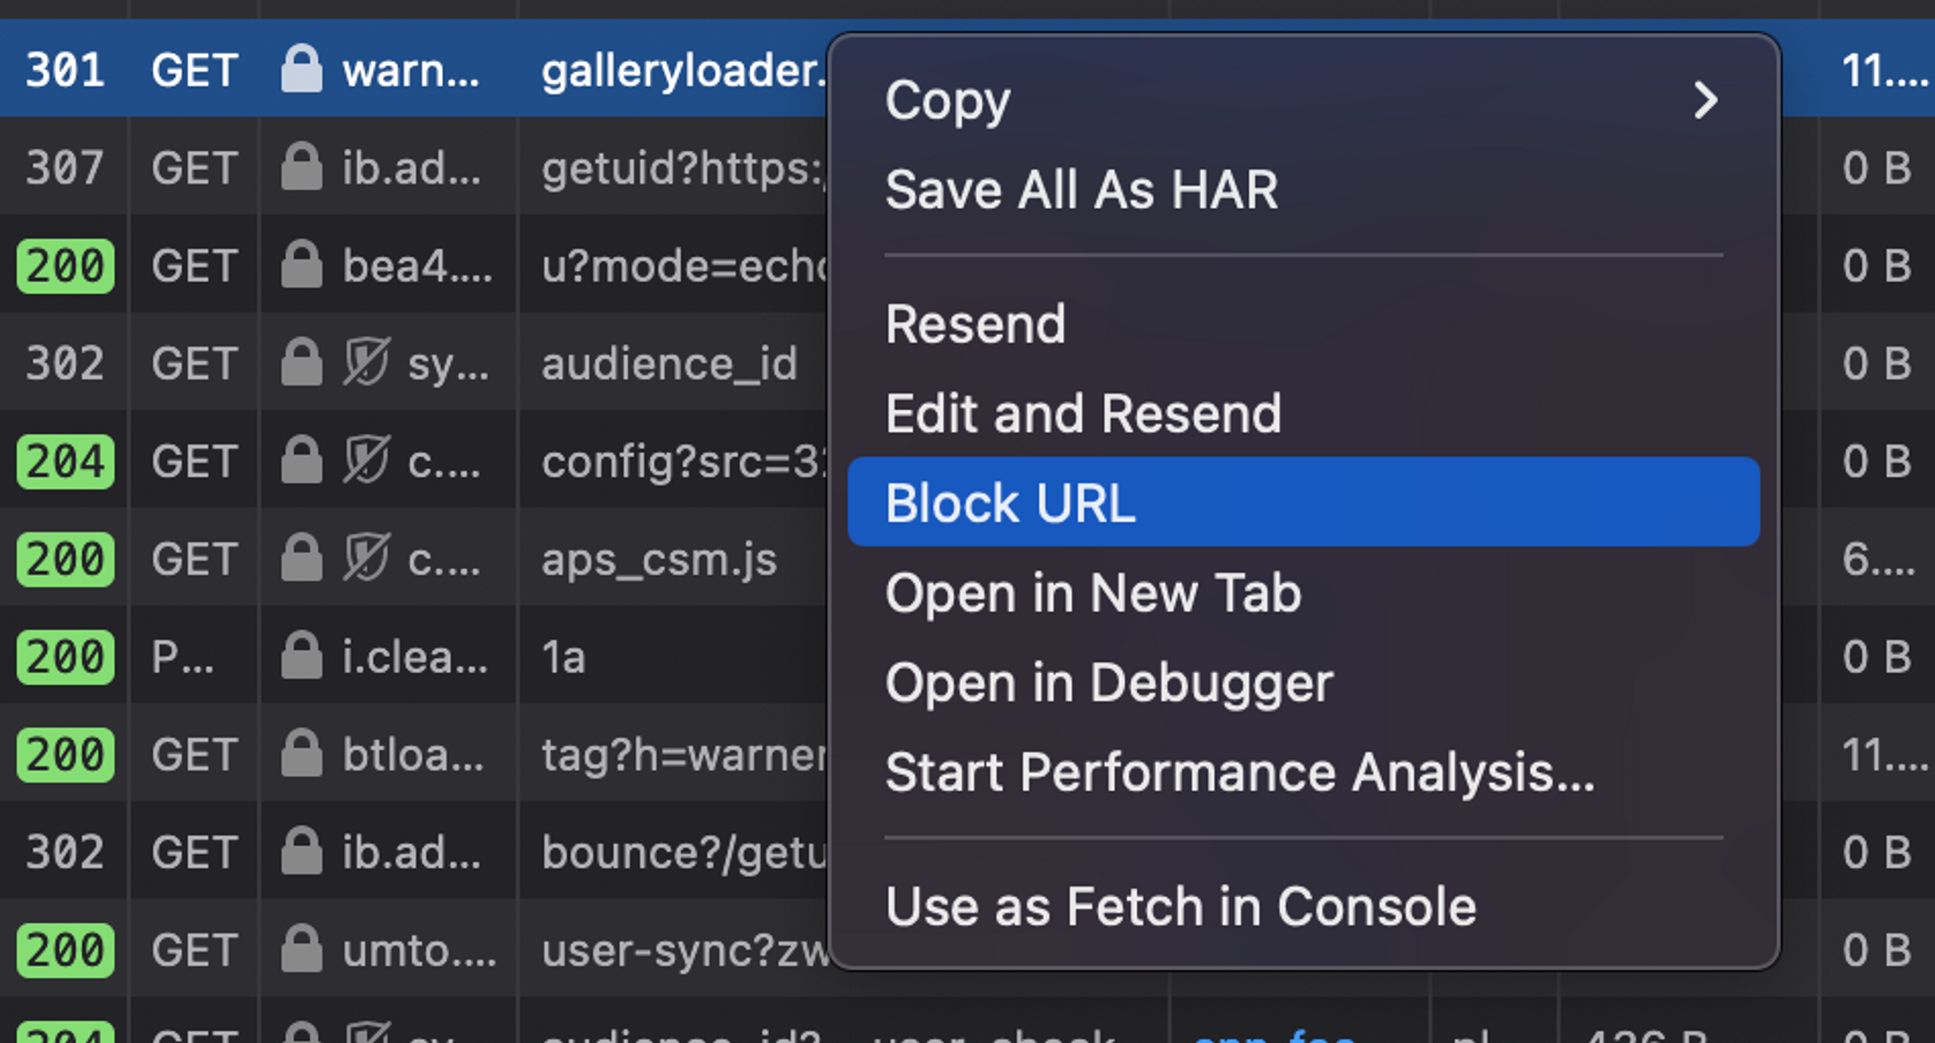
And while you can block specific request URLs or domains using Dev Tools, that doesn’t simulate what happens when a domain is simply sluggish.
Alternatively, you can run a SPOF test using WebPageTest to see how a page loads if requests to certain URLs or domains time out.
But aside from scripting interactions, you won’t really be able to experience what it’s like to load a page that’s dragging its feet. That’s why I came up with a solution to SPOF test using Puppeteer.
Use Puppeteer to throttle network requests
After digging around Addy Osmani’s wonderful collection of Puppeteer recipes, I found that Puppeteer makes it easy to emulate a slow network – and even intercept requests and forward responses after certain time.
And if you want to interact with a page while specific requests are throttled, you need to run Chrome in Remote Debugging mode and connect Puppeteer to its web socket.
Here’s how:
Install Puppeteer.
Start a fresh instance of Chrome that opens a port for remote debugging via CLI. Copy the websock address that is output.
/Applications/Google\ Chrome.app/Contents/MacOS/Google\ Chrome --remote-debugging-port=9222 --no-first-run --no-default-browser-check --user-data-dir=$(mktemp -d -t 'chrome-remote_data_dir')

# DevTools listening on ws://123.0.0.1:9222/devtools/browser/c8ei5693-41k2-388s-939e-ee9egj2342e3- In a directory for your puppeteer scripts, save the following file as
request-interceptor.js. Paste your open websocket endpoint and the list of domains and or URLs you wish to throttle as commented.
const puppeteer = require('puppeteer');

// Add your list of domains and/or URLs that you want to throttle
const interceptList = [
    'cdn.jsdelivr.net',
    'unpkg.com/prismjs@1.27.0/prism.js'
];

(async () => {
  // Connect to an open browser websocket endpoint by
  // replacing the URL with the one generated
  // when you open a new Chrome instance.
  // See https://pptr.dev/#?product=Puppeteer&version=v13.5.1&show=api-puppeteerconnectoptions.
  const wsChromeEndpointUrl = 'ws://123.0.0.1:9222/devtools/browser/c8ei5693-41k2-388s-939e-ee9egj2342e3';
  const browser = await puppeteer.connect({
    browserWSEndpoint: wsChromeEndpointUrl,
    defaultViewport: null,
  });

  // Instead of creating a new page, we need to get the current active tab
  // const page = await browser.newPage();
  const pages = await browser.pages();
  // This will return list of active tabs. Compare https://stackoverflow.com/a/68671806/7849314
  const visiblePages = pages.filter(async (p) => {
    const state = await p.evaluate(() => document.visibilityState);
    return state === 'visible';
  });
  const page = visiblePages[visiblePages.length - 1];

  const options = {
    waitUntil: 'networkidle2',
    timeout: 30000
  };

  // 👾👾👾 INTERCEPT REQUESTS 👾👾👾
  // See: https://pptr.dev/#?product=Puppeteer&version=v13.5.1&show=api-pagesetrequestinterceptionvalue
  await page.setRequestInterception(true);

  page.on('request', request => {
    const url = request.url()
    if (interceptList.some(d => url.includes(d))) {
      setTimeout(() => {
        request.continue();
      }, 5000); // Update the timeout as needed.
    } else {
      request.continue();
    }
  });

  await page.reload(options);
  // Terminate the process manually to stop Puppeteer.
})();
Run the Puppeteer script with
node request-interceptor.js.In the Chrome instance for Remote Debugging, open Dev Tools to the Network tab. Then open or reload the page you want to debug. You may have to allow all cookies so that all third-party resources load. You can click around the page to see whether interactions are blocked.

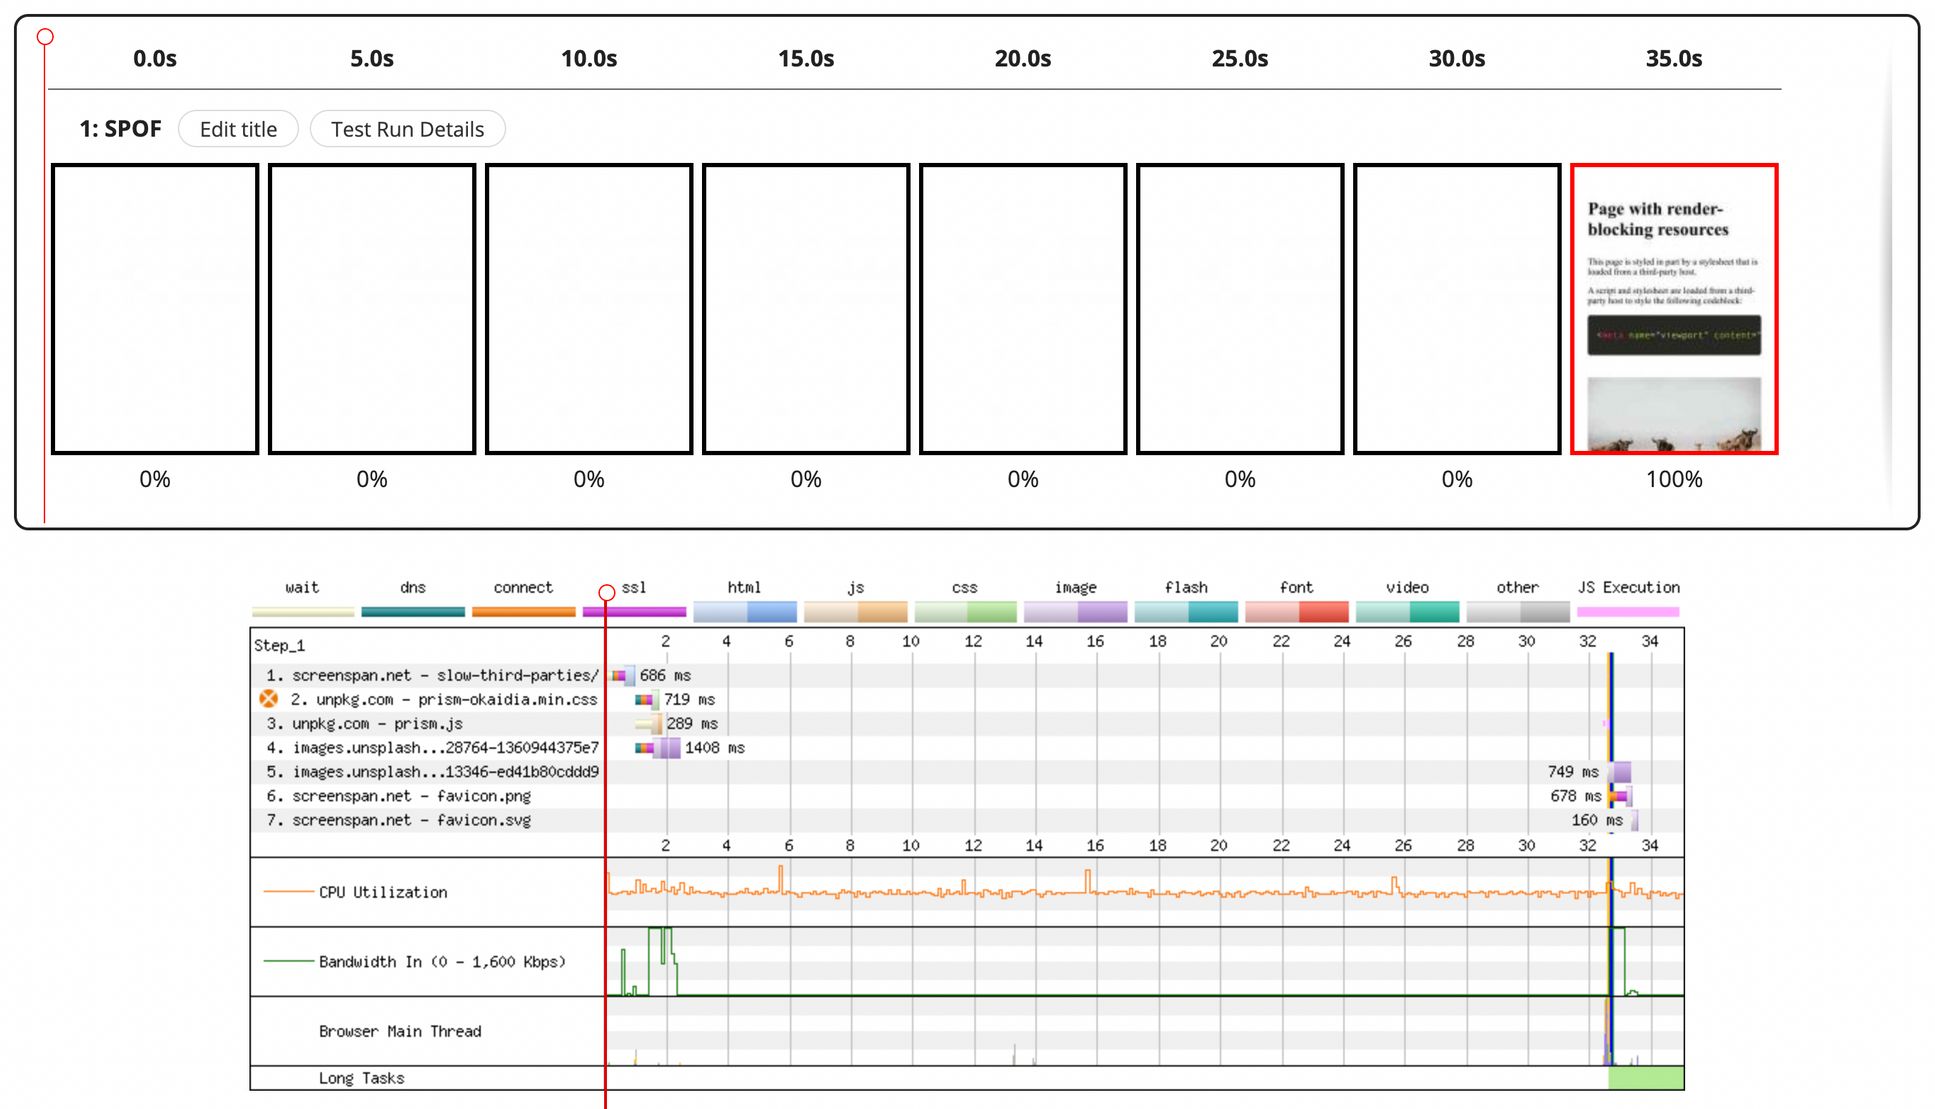
Intercepted requests will have long trail in the Network tab
Demo
I built a simple web page that includes render-blocking stylesheets served from third-party domains and a synchronously-loading third-party script:
<!DOCTYPE html>
<html lang="en">
<head>
<!-- Some meta stuff -->
<!-- Render-blocking stylesheet -->
<link href="https://cdn.jsdelivr.net/npm/bootstrap@5.1.3/dist/css/bootstrap.min.css" rel="stylesheet" ... crossorigin="anonymous">
<style><!-- Inline style --></style>
</head>
<body>
<!-- Some content -->
<!-- Clicking this button displays a message on the page. But the script for that is blocked by a preceeding synchronous script. -->
<button id="blocked-by-other-scripts">
<!-- If this synchronous script is delivered slowly or not at all, all other scripts thereafter will not run. -->
<script src="https://unpkg.com/prismjs@1.27.0/prism.js"></script>
<!-- This script for the button is blocked by the preceeding third-party script. -->
<script>...</script>
</body>
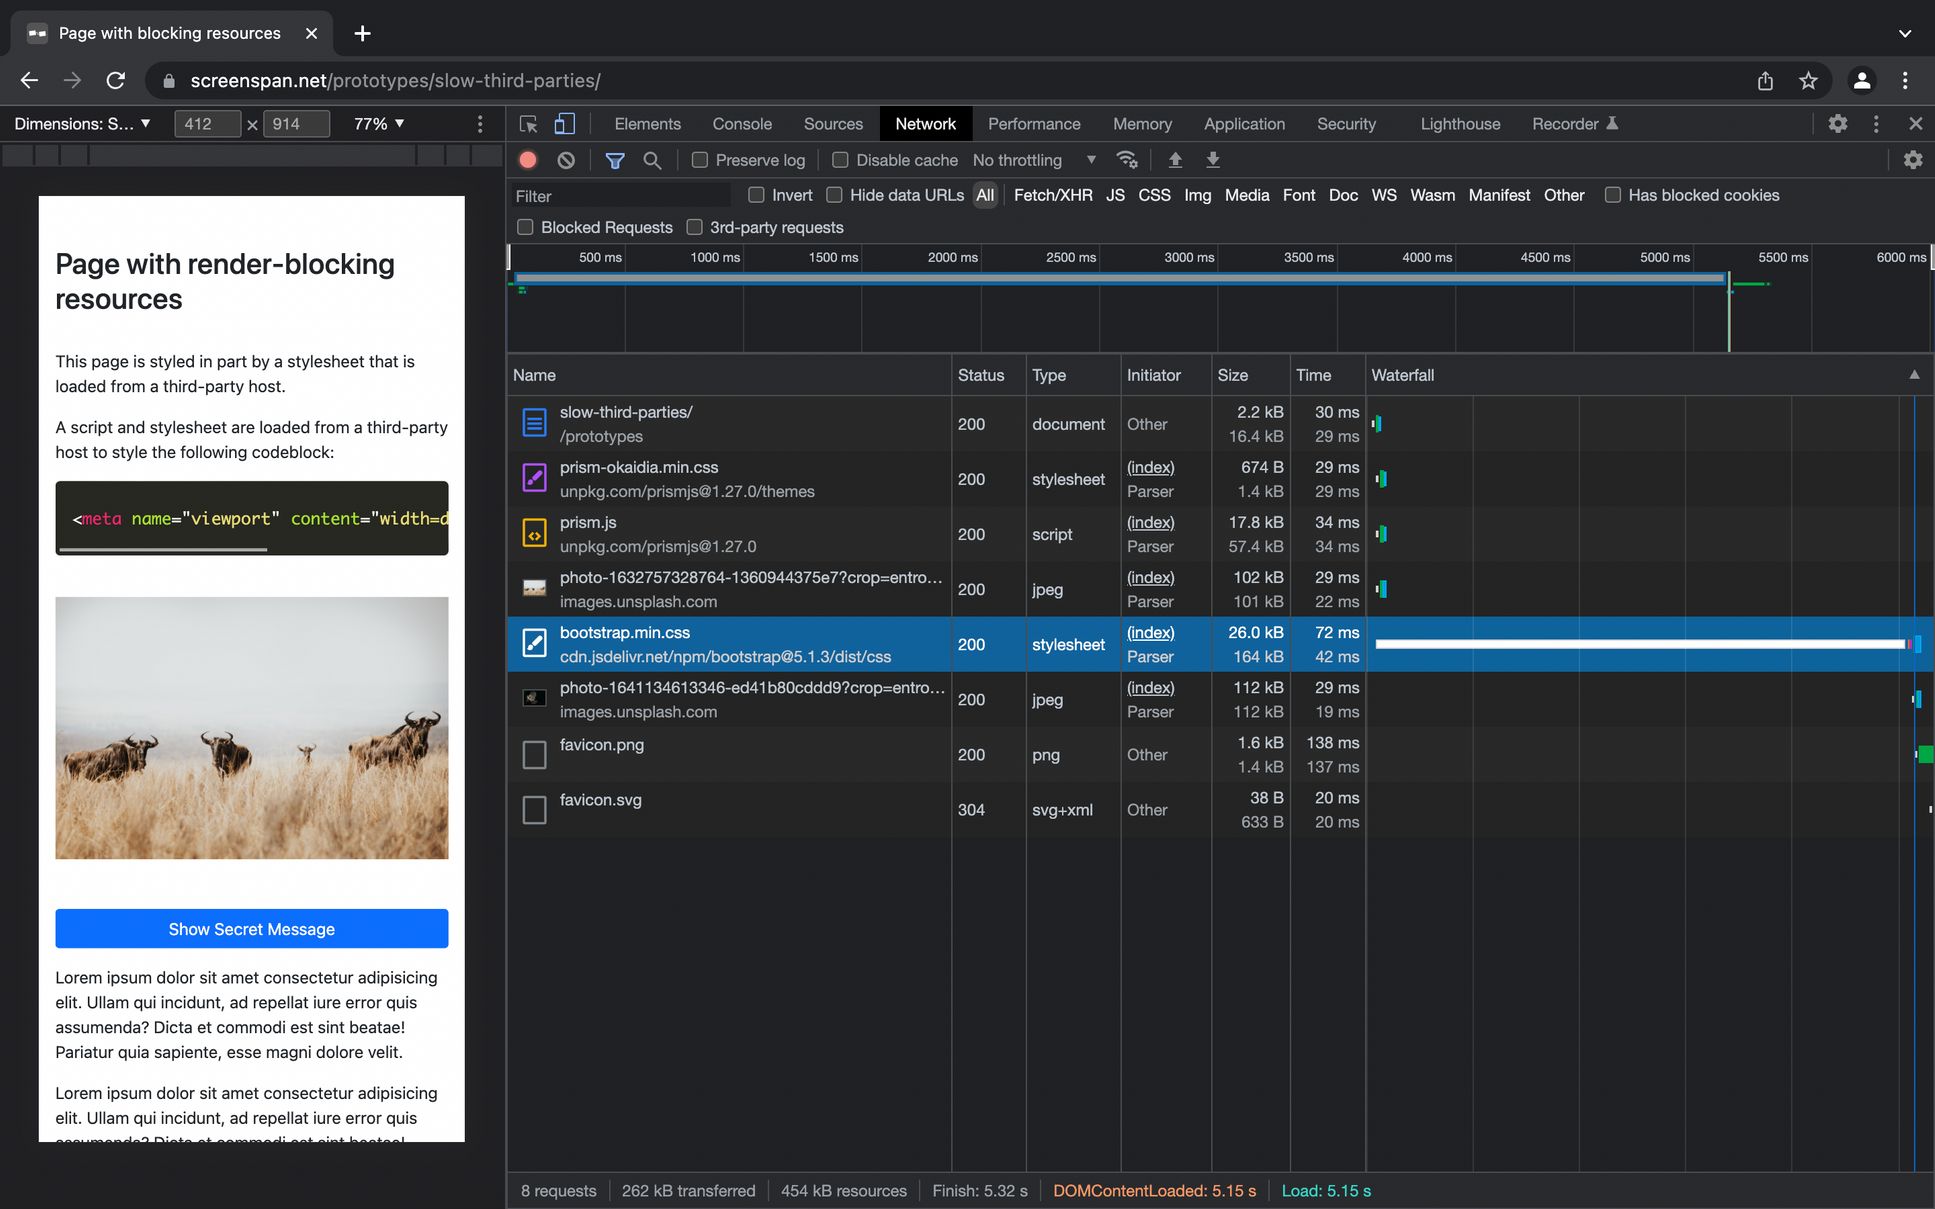
</html>When I add the domain cdn.jsdelivr.net that serves the render-blocking stylesheet to the interceptList in request-interceptor.js and then run the Puppeteer script, you can see that rendering is indeed blocked until after the timeout I set.
When I throttle the domain unpkg.com that serves a synchronously-loading JavaScript file which is preceeds other scripts in the DOM, you can see that interaction is blocked.
Closing thoughts
If third-parties are lagging or failing on your site, your Real User Monitoring (RUM)'s load event and number of 4XX and 5XX errors will show anomalies.
And perhaps you could use the Resource Timing API to spot requests with a long duration – the time from when a request queues to when it has finished downloading.
try {
  const observer = new PerformanceObserver((entryList) => {
    for (const entry of entryList.getEntries()) {
      // Here we're checking for durations longer than 500ms.
      if (entry.duration >= 700) {
      	// Send to RUM
        console.log(entry);
      }
    }
  });
observer.observe({ type: 'resource', buffered: true });
} catch (e) { console.log(e) }
Still, with users’ trust and dollar on the line, it’s better to be proactive than reactive. Using Puppeteer as described will help you spot potentially harmful dependencies on your pages so you can do something about it.